A $34.5 Billion Market, a $2 Billion Slice
Tokenized real-world assets (RWAs) have grown from a niche experiment into a market worth tens of billions of dollars:
Market size: the tokenized RWA market, excluding stablecoins, is $34.5 billion at the end of August, up 140% in a year.
Credit: tokenized credit more than doubled over the same period, to $7.8 billion.
Treasuries: according to Pantera, tokenized US Treasuries rose from $13 billion to $16.5 billion in the second quarter of 2026 alone.
New products: Pantera also counts 45 new tokenized products launched in the first half of the year.
Institutions: DTCC's tokenization service is scheduled to launch in October, and Bitwise opened an RWA vault on Morpho in September.
Issuing a token is only the first step. For tokenized assets to work like assets in traditional finance, they also need to be usable as collateral, which means accepted by lending markets and borrowed against. Lending use is still catching up with issuance. About 6.1% of tokenized RWA supply, roughly $2.1 billion, is currently deployed in DeFi lending protocols.
This issue examines that slice in detail on the three protocols where most of it sits: Morpho, Kamino and Aave. It covers which RWA tokens are posted as collateral, what is borrowed against them, how much leverage borrowers take and what the positions earn. The figures describe the market on 1 October 2026.
What Counts as an RWA Here
The data covers every lending market on Morpho, Kamino and Aave that accepts an RWA token as collateral, down to the individual borrower position. That is about 10,200 positions. Borrower addresses are anonymised and play no part in the analysis.
The analysis uses a broad definition of RWA, which includes:
Tokenized credit to off-chain borrowers: home-equity loans, auto loans, trade receivables, payment financing, CLOs and private credit funds.
Crypto-linked credit: tokens whose underlying loans go to crypto firms or are secured by crypto. Maple's syrup tokens are the largest example. This group is shown separately because it behaves differently from credit to non-crypto borrowers.
Reinsurance, tokenized equities, gold, and tokenized Treasuries and money-market funds.
Crypto-native strategies, such as delta-neutral synthetic dollars and basis-trade vaults that are not regulated funds, are excluded, as are plain stablecoins.
Three measures recur:
LTV (loan-to-value): debt divided by collateral value, averaged across positions and weighted by collateral size.
Collateral yield: each token's own price or NAV change over the last 30 days, annualised, plus any incentive paid for posting it as collateral.
Net APY on equity: the return on the borrower's own capital once leverage and borrowing costs are included. A borrower who posts $100 of collateral and borrows $80 has $20 of their own money in the position, so leverage is 5x. The net return is the collateral yield on $100 minus the interest paid on $80, divided by $20.
Credit Dominates, Treasuries Sit Out
The three protocols hold $2.20 billion of RWA collateral, with $1.66 billion borrowed against it.
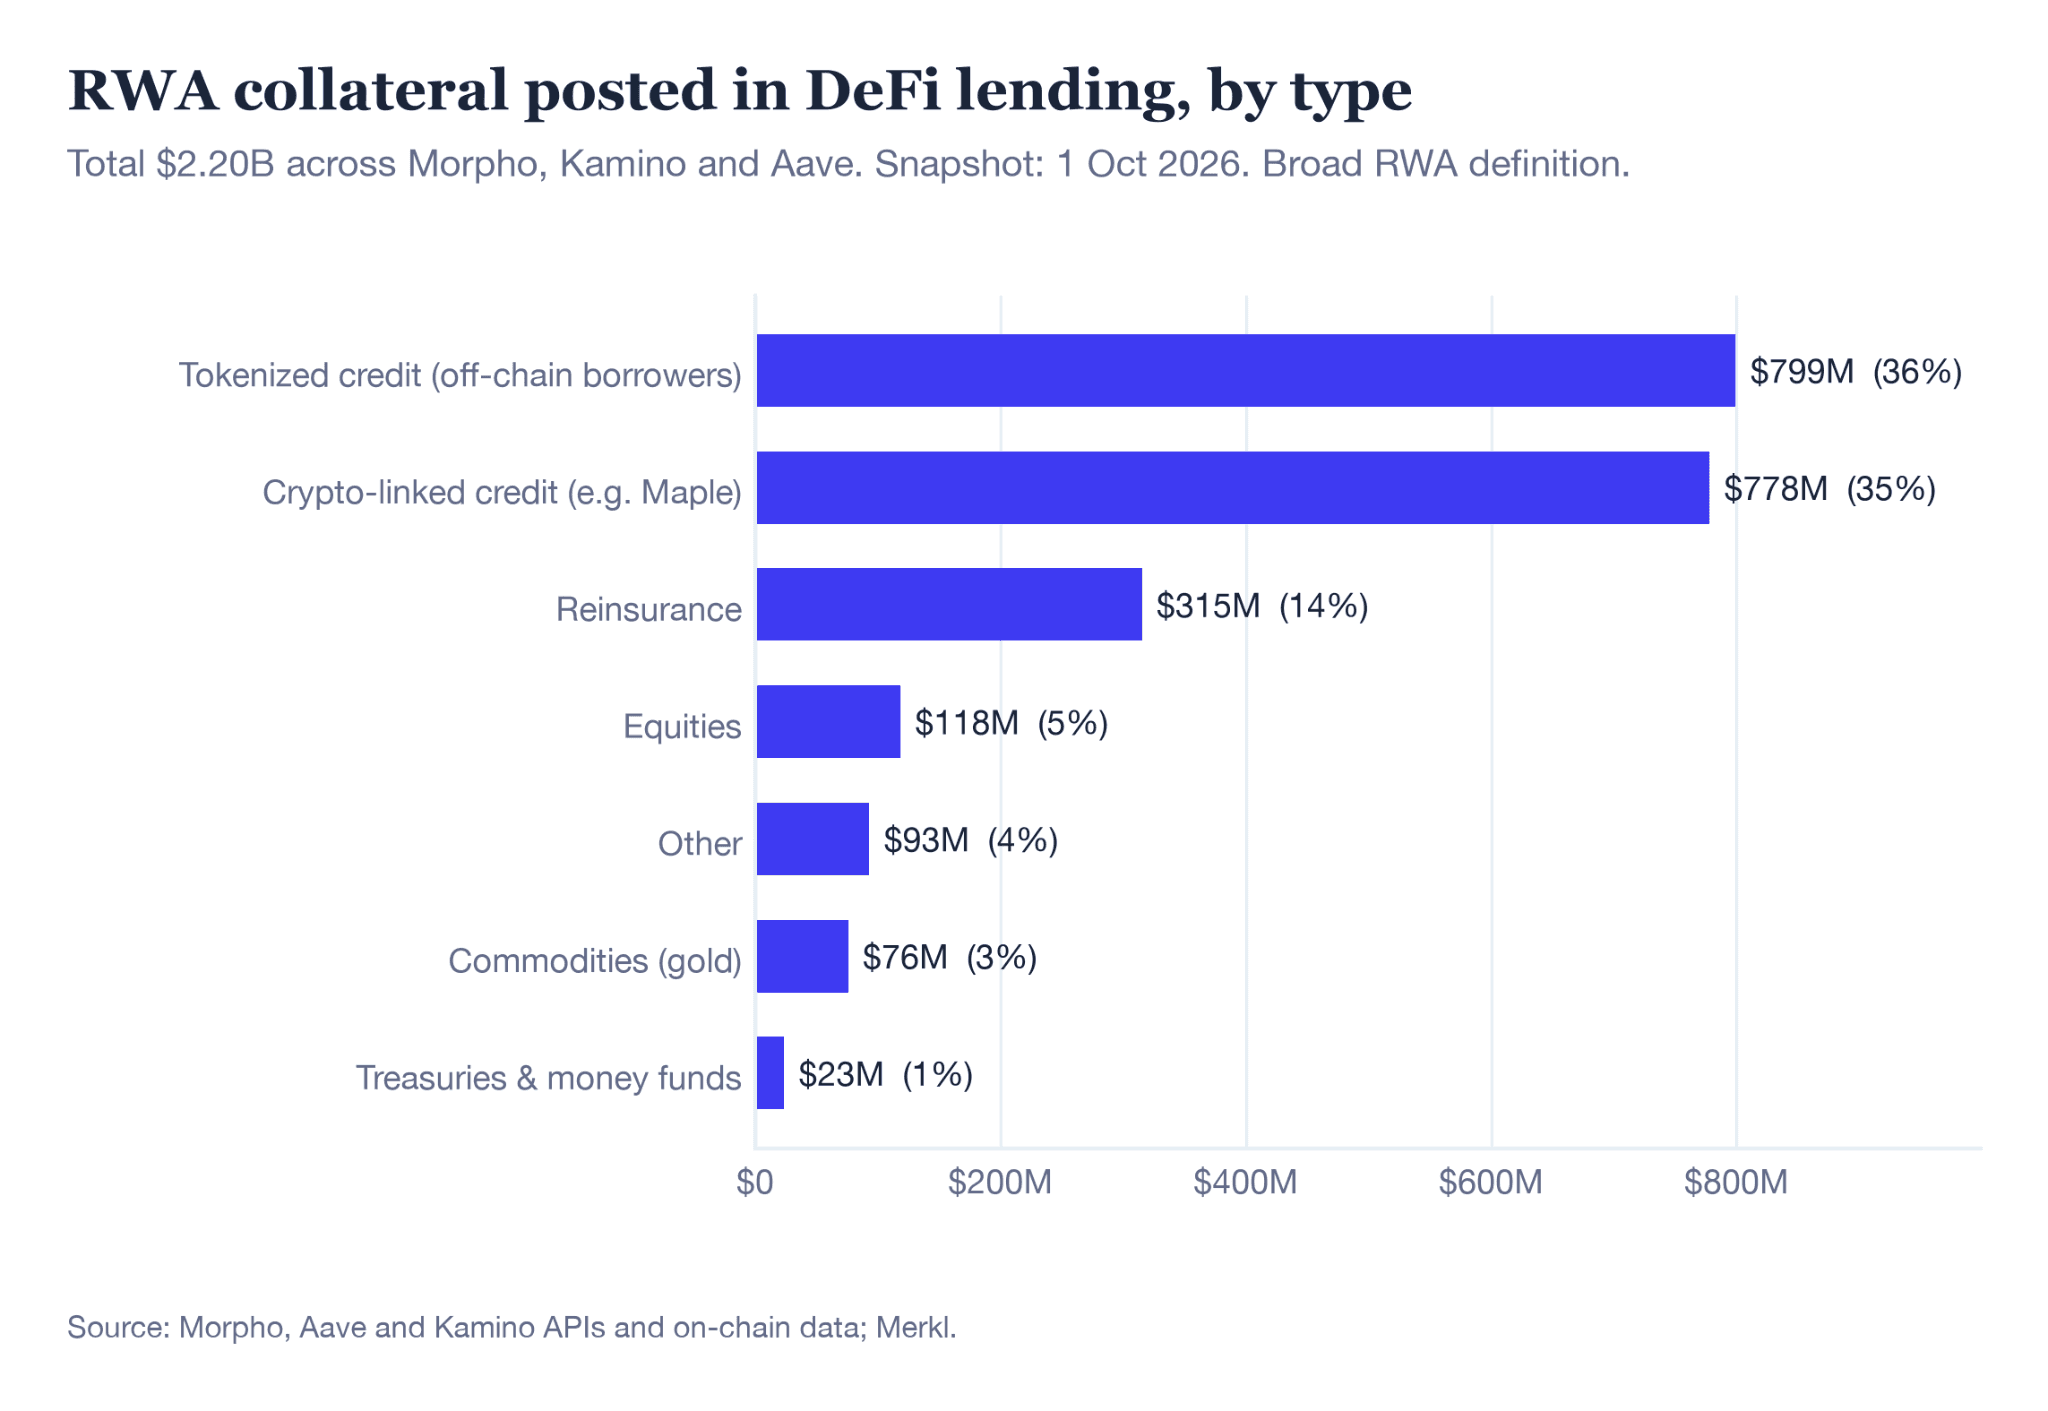
Credit makes up most of it:
Credit to off-chain borrowers: $799 million, or 36%.
Crypto-linked credit: $778 million, or 35%. Maple's syrup tokens (syrupUSDC, syrupUSDT and syrupUSDG) account for $641 million of that, or 29% of all RWA collateral.
Reinsurance: $315 million, or 14%. Most of it is OnRe's ONyc and Re's reUSD, which is held largely through a Pendle principal token (PT-reUSD).
Equities: $118 million, or 5%.
Gold: $76 million, or 3%.
Tokenized Treasuries and money-market funds: $23 million, about 1% of the total. About $17.8 billion of tokenized cash equivalents in circulation, so very little of that supply is posted as collateral in these markets.
Credit, including crypto-linked credit, makes up 72% of RWA collateral. If reinsurance is also counted as credit, as some data providers do, the share rises to about 86%. The exact figure depends heavily on where these lines are drawn, which is why each group is reported separately.
The collateral is also concentrated in a few tokens:
The five largest tokens make up 53% of the total. These are Figure's PRIME (home-equity loans), syrupUSDC, syrupUSDT, syrupUSDG and ONyc.
The ten largest tokens make up 75%.
PRIME alone accounts for $365 million across Morpho and Kamino.
How the Collateral is Distributed
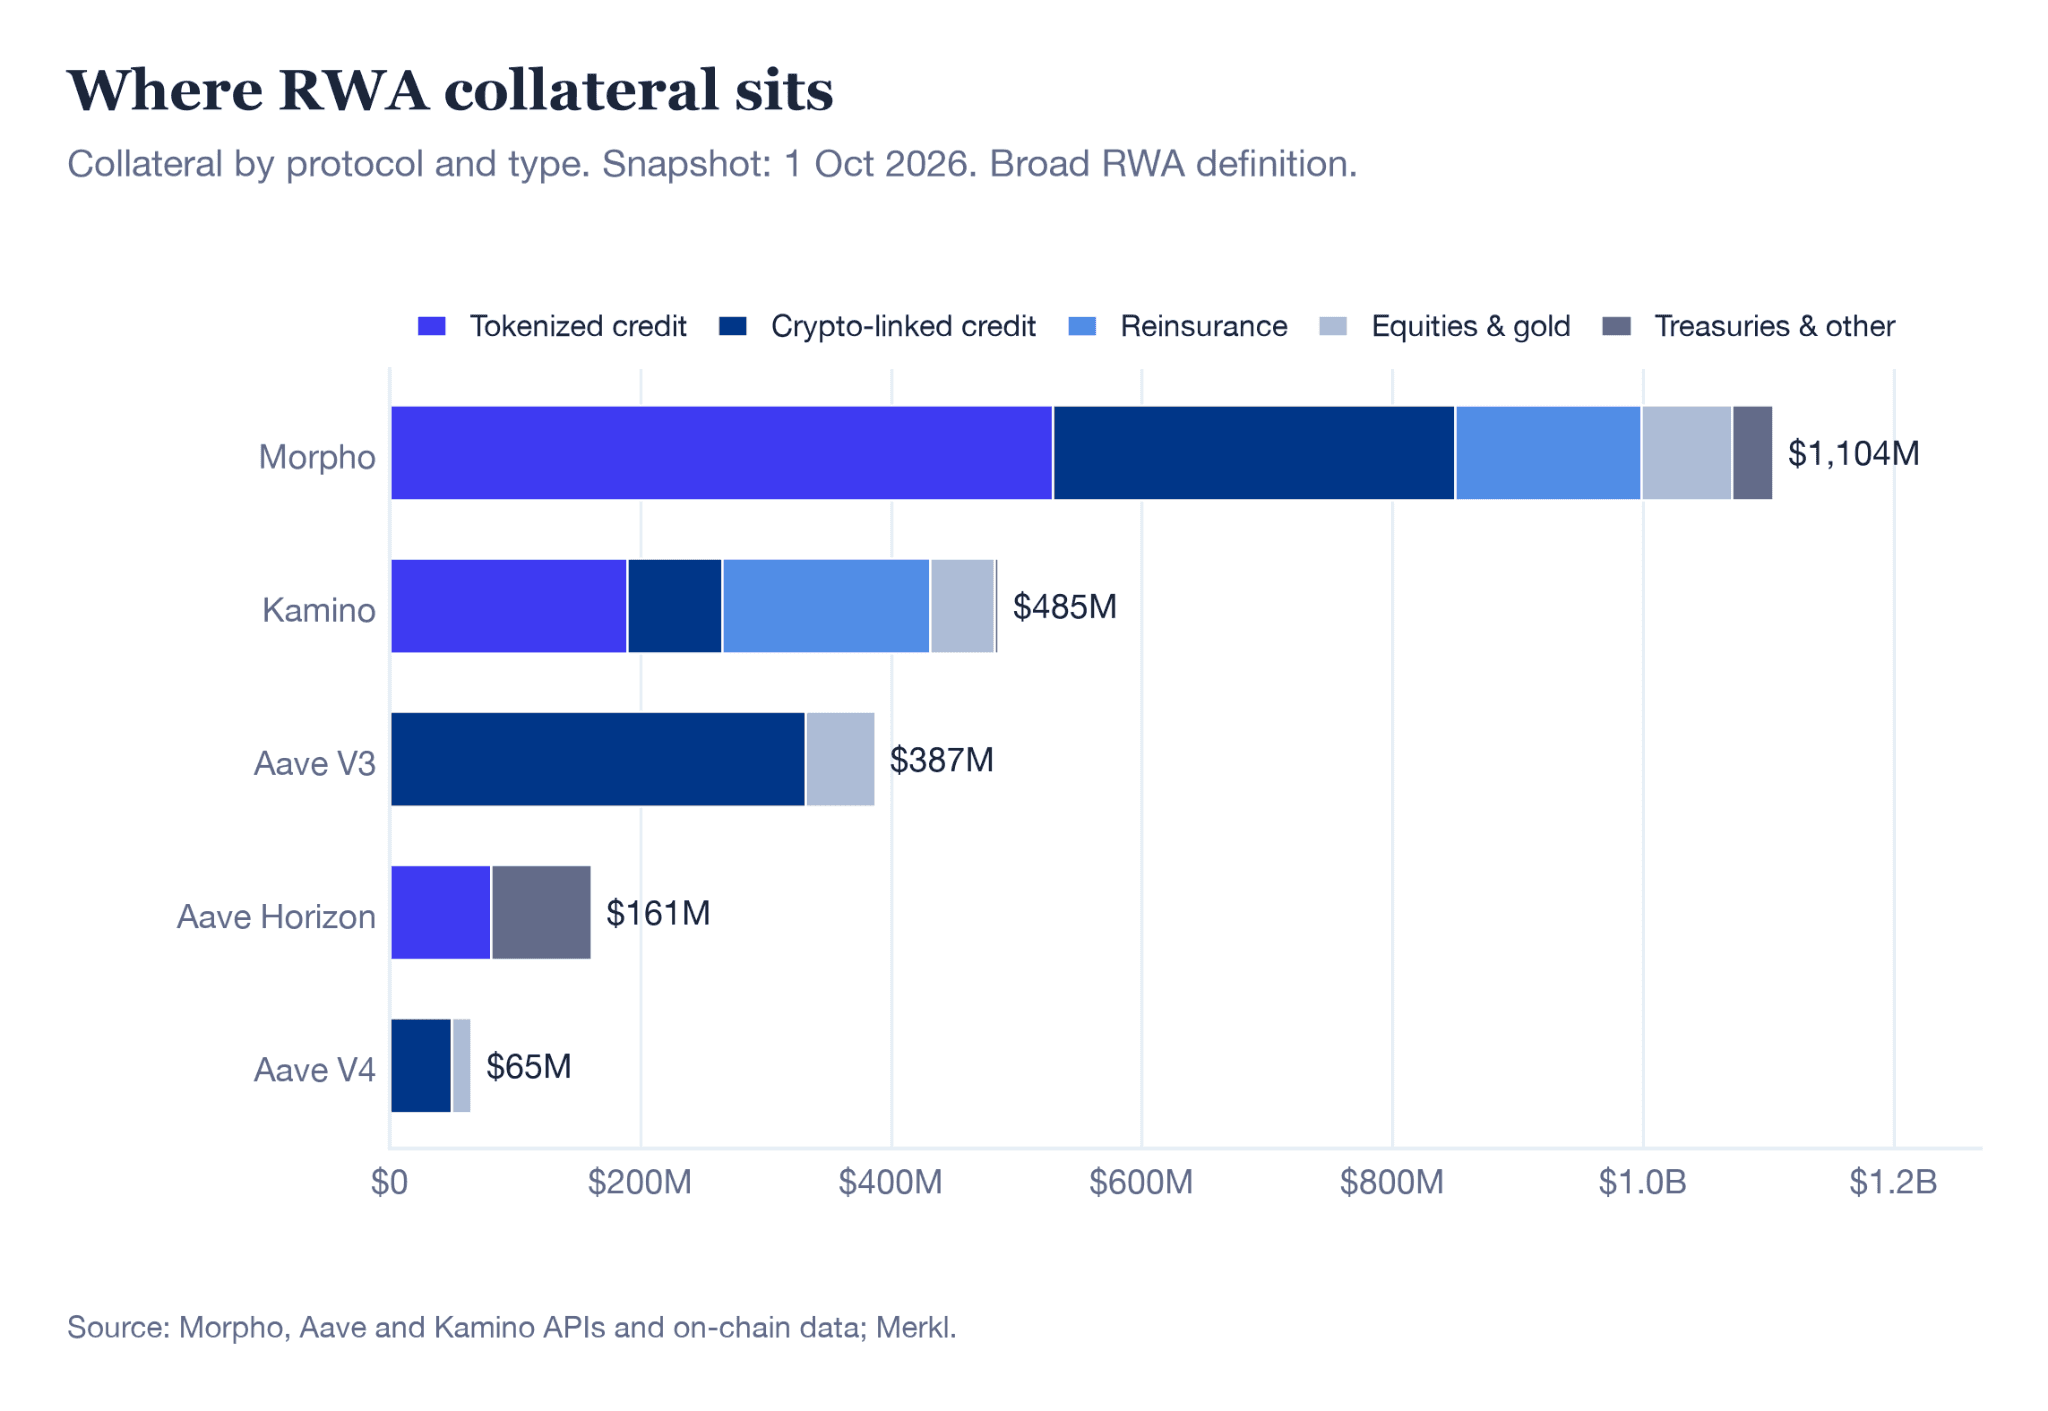
Morpho holds $1.10 billion, half the total. Because Morpho runs separate markets for each collateral and loan asset pair, it lists the widest range of RWA tokens. The largest are:
PRIME: $270 million.
PT-reUSD: $136 million.
syrupUSDG on Robinhood Chain: $128 million.
PST, Huma's payment-financing token: $103 million.
Kamino, on Solana, holds $485 million. A larger share of its RWA collateral is reinsurance than on any other protocol, mainly ONyc at $155 million. It also holds PRIME ($95 million), syrupUSDC and PST.
Aave holds $613 million across three separate deployments:
Aave V3 ($387 million): almost entirely Maple syrup tokens. The largest single line is syrupUSDC on Aave's Monad deployment, at $144 million.
Aave Horizon ($161 million): Aave's permissioned RWA market. It holds tokenized credit such as JAAA (a AAA CLO fund) and Fasanara's mGLOBAL, plus Superstate's USCC and a small amount of tokenized Treasuries.
Aave V4 ($65 million): mostly syrupUSDG, plus some gold and tokenized stocks.
Within individual markets, the collateral is often held by very few positions:
On Morpho, PRIME collateral is spread across about 100 positions. The largest holds 19% and the top ten hold 78%.
PST on Morpho has 25 positions. The largest holds 19% and the top ten hold 97%.
In Aave V3's syrup markets, the largest position holds 54% of syrupUSDT and 25% of syrupUSDC on Monad. On Morpho, one position holds 81% of the syrupUSDC collateral.
Kamino's markets are the most spread out. ONyc collateral sits in about 1,900 positions, and the largest holds 17%.
The headline totals therefore partly reflect the choices of a small number of large borrowers.
The Stablecoin Side of the Trade

Borrowing is almost all in US-dollar stablecoins:
Borrowed token | Amount | Share of total |
|---|---|---|
USDC | $560 million | 34% |
PYUSD | $380 million | 23% |
USDT (incl. USDT0) | $239 million | 14% |
USDG | $220 million | 13% |
RLUSD | $97 million | 6% |
GHO | $51 million | 3% |
The mix differs a lot by protocol, and mostly follows which stablecoins each market lists:
Morpho: borrowing is split across USDC (38%), PYUSD (35%) and USDG (17%).
Kamino: USDC is just over half.
Aave V3: USDT and USDT0 make up 64%.
Aave Horizon: 74% is Ripple's RLUSD; most of the rest is GHO.
Aave V4: 87% is Paxos's USDG.
How Close to the Liquidation Line
Across all RWA collateral, the collateral-weighted average LTV is 75%.
Average LTV | |
|---|---|
By protocol | |
Aave V3 | 83% |
Aave V4 | 78% |
Aave Horizon | 78% |
Morpho | 77% |
Kamino | 64% |
By collateral type | |
Crypto-linked credit | 85% |
Tokenized credit (off-chain) | 75% |
Reinsurance | 69% |
Treasuries & money funds | 61% |
Gold | 49% |
Equities | 46% |
The type of collateral explains much of the difference between protocols. Aave V3 is mostly syrup tokens, which are run at high LTVs. Kamino holds more reinsurance and equities, which are run at lower ones.
Average LTV alone doesn't show how much room a position has before liquidation. The chart below compares each large position's average LTV with the LTV at which it would be liquidated.

Two patterns stand out:
Syrup token loops run close to their liquidation points. syrupUSDC on Aave Monad and syrupUSDG on Aave V4 average 90% LTV against a 92% liquidation threshold. syrupUSDG on Morpho's Robinhood Chain market is at 89% against 91.5%.
Other collateral keeps more room:
PRIME on Morpho: 73% against 86%.
PST on Morpho: 72% against 86%.
ONyc on Kamino: 56% against 75%.
Gold on Aave V3: 50% against 75%.
How much this room matters depends on how the collateral is priced. Most of the credit and reinsurance tokens here are priced by an oracle that tracks the fund's NAV, not a traded market price. NAV-priced collateral does not move with daily market swings, so a position near its limit is less exposed to sudden price drops than one backed by a volatile token. It is still exposed in two ways:
A NAV write-down. In the past month Apollo's ACRED reported a negative 30-day return after a NAV markdown, which shows this happens.
Interest building up. If the borrow rate stays above the collateral yield, the debt grows faster than the collateral and the LTV creeps up over time. At a 90% LTV against a 92% threshold, a fall of a little over 2% in collateral value relative to debt is enough to trigger liquidation.
Double-Digit Returns on Thin Spreads
The chart below shows three numbers for each of the 14 largest NAV-priced positions: the collateral yield, the borrow rate, and the resulting net APY on the borrower's own capital.

Weighted by collateral, the NAV-priced positions (83% of the collateral) look like this:
Collateral yield | Borrow rate | Leverage | Net APY on equity | |
|---|---|---|---|---|
Morpho | 6.2% | 5.3% | 4.5x | 10.0% |
Kamino | 8.4% | 6.5% | 3.3x | 12.0% |
Aave V3 | 5.5% | 4.8% | 8.3x | 11.2% |
Aave Horizon | 5.0% | 3.4% | 5.4x | 11.6% |
Aave V4 | 5.0% | 4.4% | 9.7x | 10.4% |
All | 6.5% | 5.3% | 4.6x | 10.8% |
Net APYs end up in a narrow 10–12% range across protocols, even though leverage ranges from about 3x to almost 10x. The difference lies in the gap between the collateral yield and the borrow rate:
Kamino borrowers earn a wider gap of about 1.9 percentage points, mostly on ONyc and PST, and use less leverage.
Aave V3 and V4 borrowers earn gaps of 0.6 to 0.7 points on syrup tokens and use much more leverage to reach a similar return.
Leverage multiplies that gap. At 9.6x, each percentage point of change in the gap moves the net APY by about 8.6 points. For tightly looped positions, small changes in borrow rates or incentives therefore cause large swings in returns.
syrupUSDC on Aave's Monad deployment shows this clearly:
Collateral yield: 5.06% from the token's NAV.
Borrow cost: the USDC borrow rate there averaged 5.5% over the month, with short spikes above 12%. Its weekly average rose from 4.9% to 6.0% over September.
Without incentives: at 9.6x leverage the position would net about 2.6%.
With incentives: a 1.24% reward for posting syrupUSDC as collateral, paid through Merkl, an incentive distribution platform, lifts the net APY to about 14.4%. In this market most of the return comes from the incentive, not the spread.
At the other end, some positions earn a wide gap:
USCC on Aave Horizon: 5.75% collateral yield against a 3.3% borrow cost, giving 17.9% at 5.9x. Horizon's borrow rates for RLUSD and GHO were among the lowest in the sample.
Fasanara's mGLO and mGLOBAL (trade receivables): about 15–16% net at 4–6x leverage.
JAAA on Horizon: at the low end. Its 3.25% yield is almost the same as its 3.2% borrow cost, so it nets about 3.4% even at 6x.
By collateral type, reinsurance positions earn the highest net APY (14.0% at 2.5x). Crypto-linked credit (10.7% at 7.1x) and off-chain tokenized credit (10.3% at 4.0x) earn similar returns, but crypto-linked credit gets there with almost twice the leverage.
RWA collateral in DeFi lending is still at an early stage relative to issuance, but it is already varied and has a clear structure. Credit products, not Treasuries, do most of the work. The split between credit to off-chain borrowers and crypto-linked credit shapes how positions are built: crypto-linked credit tends to run at higher leverage on thinner spreads. Because most of this collateral is priced by NAV oracles, positions are largely insulated from daily market swings. They remain sensitive to borrow rates, incentive programmes and occasional NAV revisions. As issuance grows and more lending markets list tokenized assets, three things are worth tracking: how much of the supply is used as collateral, how the gap between collateral yields and stablecoin borrow rates develops, and whether collateral spreads beyond a handful of large tokens and positions.
Disclaimer: The information provided in this newsletter is for educational and informational purposes only and does not constitute financial, investment, or legal advice.