
Ethereum's Unshakable Reign
Leading with the quantitative context, Ethereum remains the undisputed dominant venue for decentralized finance. Despite the persistent narrative of alternative Layer 1 networks cannibalizing market share, the data tells a different story. As clearly illustrated in the chart below, Ethereum currently commands a massive 56.6% share of all DeFi liquidity. This dominant position underscores its role as the primary settlement layer and deepest liquidity sink in the digital asset economy, leaving all other chains to compete for the remaining share.
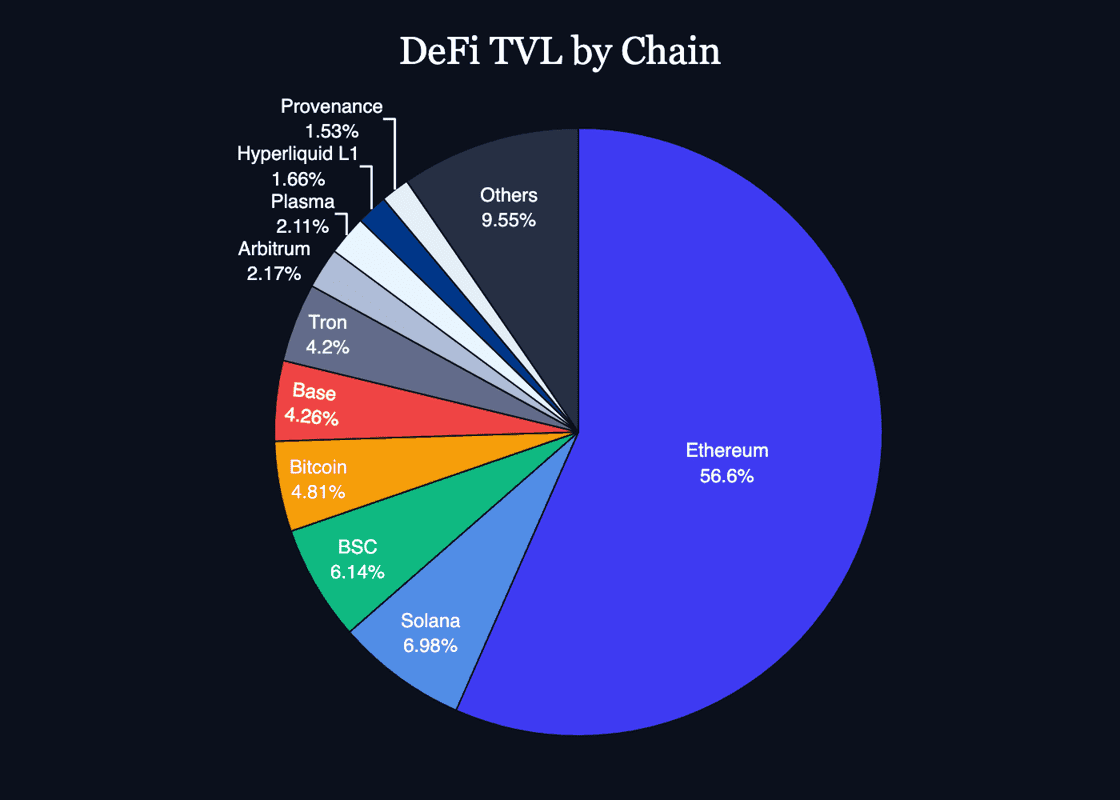
Source: Defillama.com
Chain Performance: L2s and Emerging Players Surge
While Ethereum holds the majority of absolute value, the most dynamic growth is happening elsewhere. Analyzing the 7-day TVL changes reveals significant movement among Layer 2 rollups and emerging chains. Base continues to demonstrate strong, steady growth, recording a 5.50% increase in TVL over the past week to reach over $4.15 billion.
However, the most notable outliers this week are Mantle and Katana. Mantle has seen a remarkable 26.20% surge in its TVL over the last seven days, pushing its total value to nearly $740 million. This growth can be largely attributed to the recent deployment of Aave on the network, which has successfully attracted substantial liquidity.
Recording a 15.46% week-over-week increase in TVL, the Kraken-incubated Layer 2 network Ink has successfully pushed its total locked liquidity to $476.2 million. This aggressive expansion highlights the growing appeal of exchange-backed rollups competing for EVM market share by offering frictionless onboarding for existing centralized exchange users. Much of this recent on-chain momentum is being catalyzed by native DeFi integrations, particularly the explosive growth of Tydro, a white-label deployment of the Aave protocol that now serves as the network's foundational credit and liquidity engine.
Even more explosive is Katana, which has witnessed a massive 212% increase in its TVL over the past week, reaching nearly $672 million. This parabolic growth is directly linked to its integration with the Morpho optimization layer, creating unique and highly attractive yield opportunities that are drawing in capital at an unprecedented rate.
Protocol Focus: The Power of Negative Borrow Rates
The top of the protocol leaderboard continues to be dominated by established lending and liquid staking giants. Aave remains the largest protocol with over $27 billion in TVL across 20 chains, while Lido follows with nearly $19.5 billion.
The real story, however, lies in the mechanics driving the explosive growth of Katana and Morpho. The Morpho protocol itself has seen a significant 22.35% TVL increase over the last week.
Looking deeper into the Katana/Morpho markets reveals the power of incentive-driven liquidity. Borrowers on Katana are currently being paid to borrow certain assets. For instance, the vbUSDT market shows a 6H rate of -29.17%, and the vbWBTC market shows a rate of -11.67% as of today. This phenomenon is a powerful magnet for liquidity and a key driver behind Katana's recent explosion.
The DeFi sector has successfully stabilized around the $90 billion TVL mark, with Ethereum maintaining its unyielding lead at 56.6% market share. The past week has been defined by the aggressive expansion of Layer 2s like Base and Mantle, and the explosive, incentive-driven growth of Katana following its Morpho integration. The current market dynamic, where users can be paid to borrow on platforms like Katana, highlights the ferocity of the competition for liquidity across the ecosystem.
Key Weekly DeFi Metrics
Our key takeaways this week:
DeFi shows growth amidst turbulent macro conditions
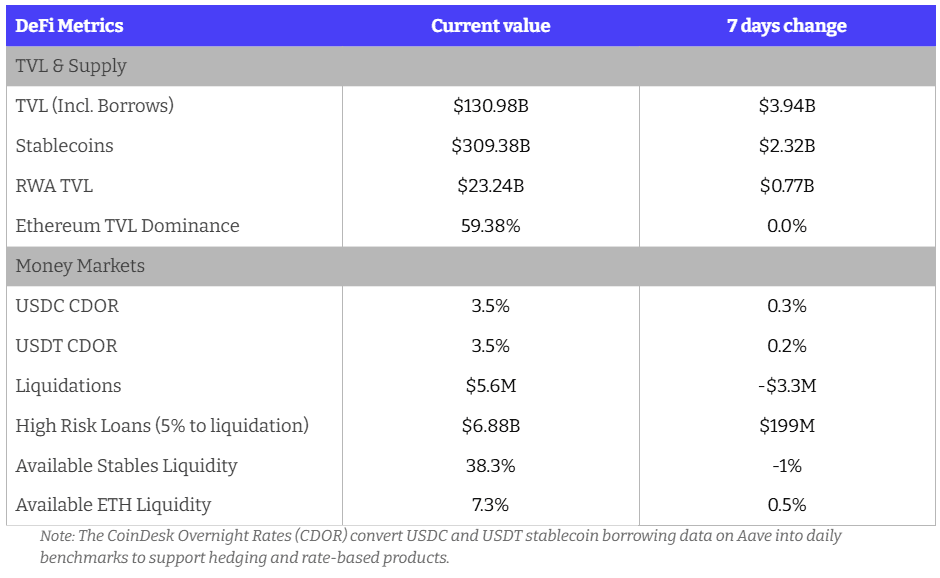
TVL and Supply growth across the board
~$4B added to TVL
$2.3B added to Stablecoins
$0.77B added to RWAs
Borrow rates increasing again with available stables liquidity beginning to decrease
ETH liquidity remains thin
Update: ETH Leverage & Carry Trades
The DeFi leveraged staking carry trade has returned to a state of fragile equilibrium. The 7-day moving average (7D MA) debt-weighted ETH borrow rate declined from 3.40% to 2.46%. This shift allowed carry spreads to move from negative to marginally positive for many positions.
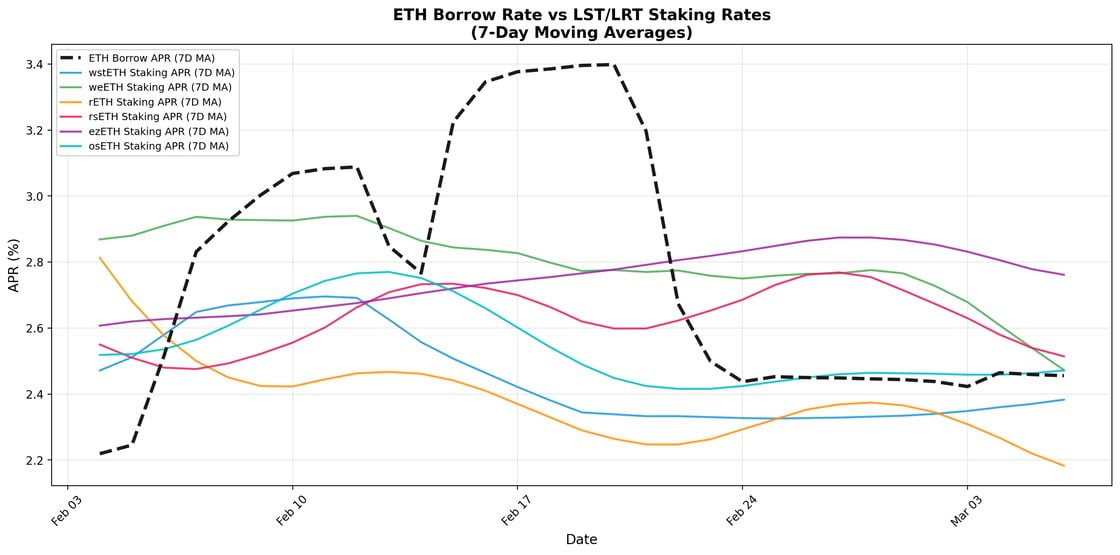
Source: Sentora & DefiLlama
The updated chart illustrates the February utilization spike and its resolution. The weighted borrow rates for ETH experienced a steep decline through early March and converged back into the cluster of LST/LRT staking yields. This mean reversion indicates that market self-correcting mechanisms remain functional, but still stressed. However, the rate spike period means leveraged positions accrued significant interest expenses for two weeks.
Integrated Risk Outlook & Operational Trends
Network conditions show improvement. The beacon chain entry queue wait time decreased from 71 to 57 days this month. Low exit queues provide a predictable liquidity environment. This normalization facilitates new validator activations. This maintains downward pressure on underlying staking rewards.
Profitability for leveraged positions remains narrow. A 5x recursive loop for positive-carry assets yields a net annualized carry of +0.10% to +1.55%. This return is earned on top of the underlying staking rate. The buffer to absorb borrow rate volatility has compressed in recent months.
Systemic risks persist. Secondary market liquidity for LRTs is thin. Protocol redemption timelines of 15 to 21 days prevent rapid exits. Users must monitor lending market utilization. Any withdrawal of ETH supply could re-invert the carry and trigger a difficult deleveraging process.