
APY tells you what a vault returned. It does not tell you why, under what conditions, or whether those conditions are likely to persist. Two vaults showing identical rates can be structurally unrelated: one drawing yield from stable lending demand, another from leveraged positions that unwind sharply when volatility rises. The number looks the same. The risk profile is entirely different.
This gap would be unremarkable if DeFi were still a niche experiment. But the capital flowing through these protocols has matured. Institutions are allocating. Family offices are asking diligence questions. Sophisticated retail participants are managing meaningful sums. The infrastructure for analysis, however, has not kept pace. Most users still evaluate yield the way they did in 2020: by looking at the biggest number on the screen.
What APY Obscures
Yield in DeFi is not one thing. It can originate from lending demand, where a protocol’s utilization rate determines the rate paid to depositors. It can come from leveraged strategies that amplify returns but also amplify exposure to collateral volatility. It can derive from liquidity provision, where the return depends on trading volume, fee tiers, and how tightly concentrated the position is around the current price. It can emerge from protocol incentives layered on top of base returns, which decay as more capital enters and disappear entirely when a program ends.
Each of these sources behaves differently under stress. Lending yields compress when utilization falls and spike when it rises toward the borrow cap. Leveraged vaults face forced deleveraging when collateral prices move against them. Liquidity positions suffer impermanent loss when the assets they hold diverge in price. Incentive-driven yields evaporate on a schedule.
A headline APY averages across all of this and presents the result as a single figure. It strips out the mechanism entirely.
The Risk Dimensions That Actually Matter
To evaluate a DeFi vault properly, the APY is the last question, not the first. The meaningful questions are structural.
Liquidity risk
A vault might hold a position that looks healthy on paper but cannot be exited cleanly under stressed market conditions. Relevant metrics here include available liquidity in the underlying pool, the price impact of a full exit. A vault yielding 12% that takes three weeks to exit cleanly in a drawdown is a different product from one that can be unwound in hours.
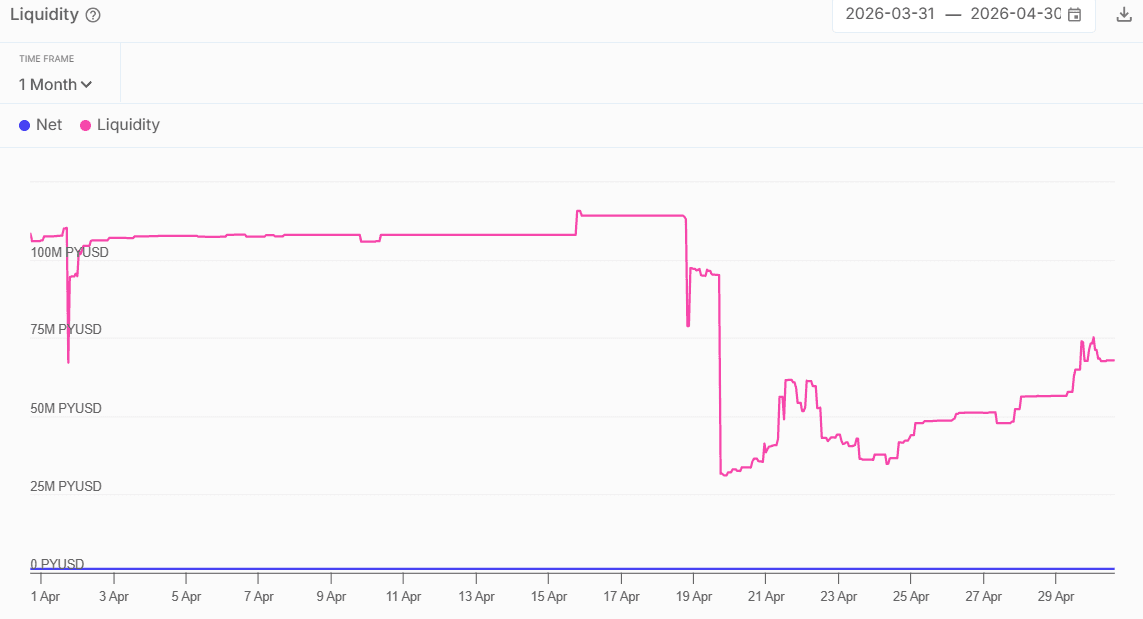
Source: defirisk.sentora.com
Concentration risk
When a large portion of a pool is held by a small number of participants, movements by any single actor can destabilize the entire position. Tracking whale concentration (the share of a pool controlled by its largest depositors) is a standard part of institutional monitoring frameworks and largely absent from retail vault interfaces.
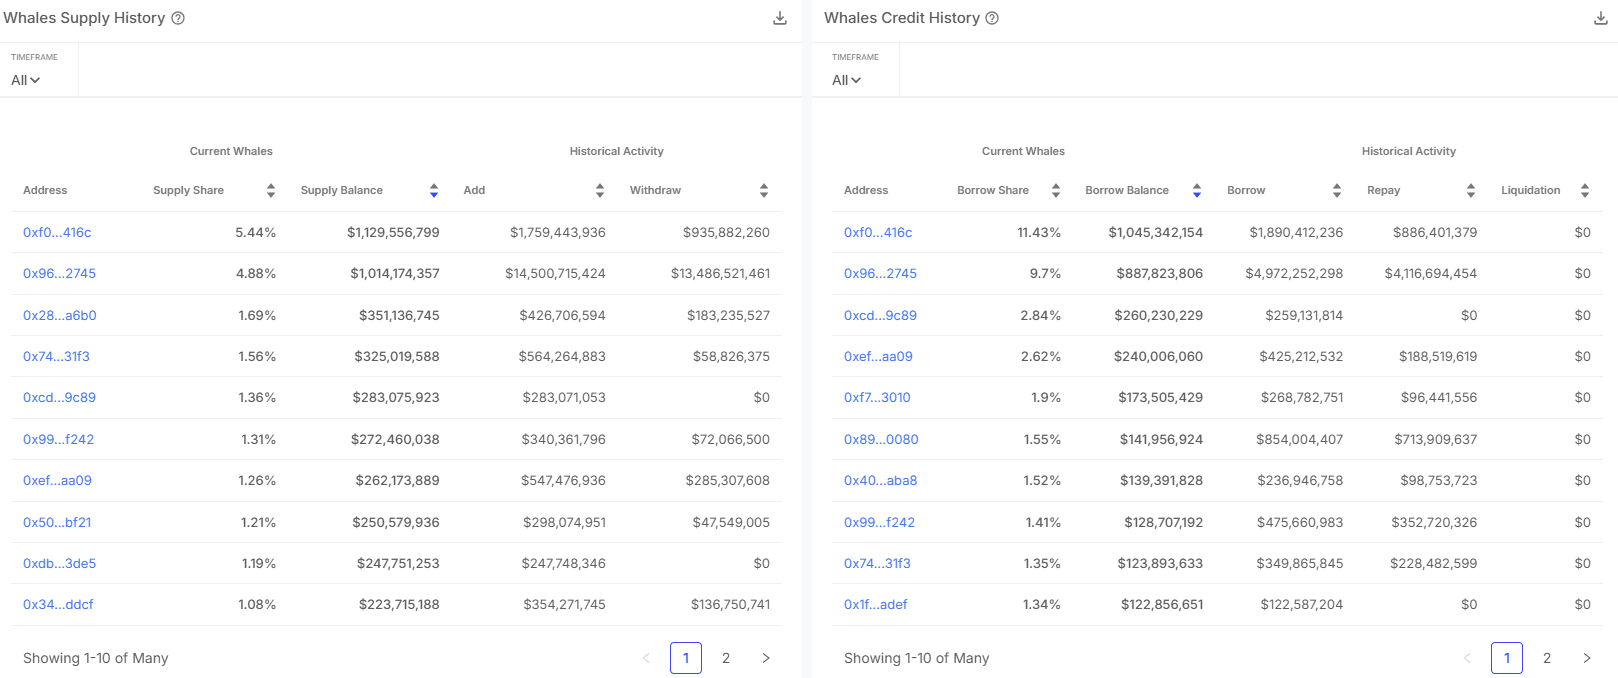
Source: defirisk.sentora.com
Leverage and correlation risk
Vaults that loop between two assets to amplify yield are structurally conservative when those assets move together: the spread stays stable even if prices fall. The same structure becomes dangerous when applied to uncorrelated assets, where price divergence can trigger rapid deleveraging and principal loss. The difference is not visible in the APY.
The Monitoring Problem
The more important point is that none of these risk dimensions are static. They evolve continuously as markets move.
A vault that cleared every pre-deployment check can become meaningfully riskier within days if utilization in its lending markets spikes, if a large depositor exits and reduces pool liquidity, or if collateral prices shift the health factor of a leveraged position toward its threshold. Risk at deposit is a snapshot. Risk over time is a process.
This is where the gap between institutional and retail practice is most visible. Professional allocators run continuous monitoring across their positions, tracking liquidity conditions, concentration changes, rate sensitivity, and leverage ratios in real time. They set thresholds and receive alerts when conditions shift. Retail users, by and large, deposit and check back when they remember to.
Some platforms are beginning to address this. Sentora’s Smart Yield interface, for instance, allows users to connect a wallet and tracks risk alerts tied to the vaults they deploy in, surfacing changes in vault conditions as markets evolve rather than requiring users to reconstruct the picture manually. The underlying monitoring framework tracks six risk categories (concentration, liquidity, interest rate, duration, leverage, and correlation) and feeds those signals into both automated on-chain triggers and user-facing alerts. The point is not that this approach is unique, but that the analytical layer it represents should be a baseline expectation, not a differentiator.
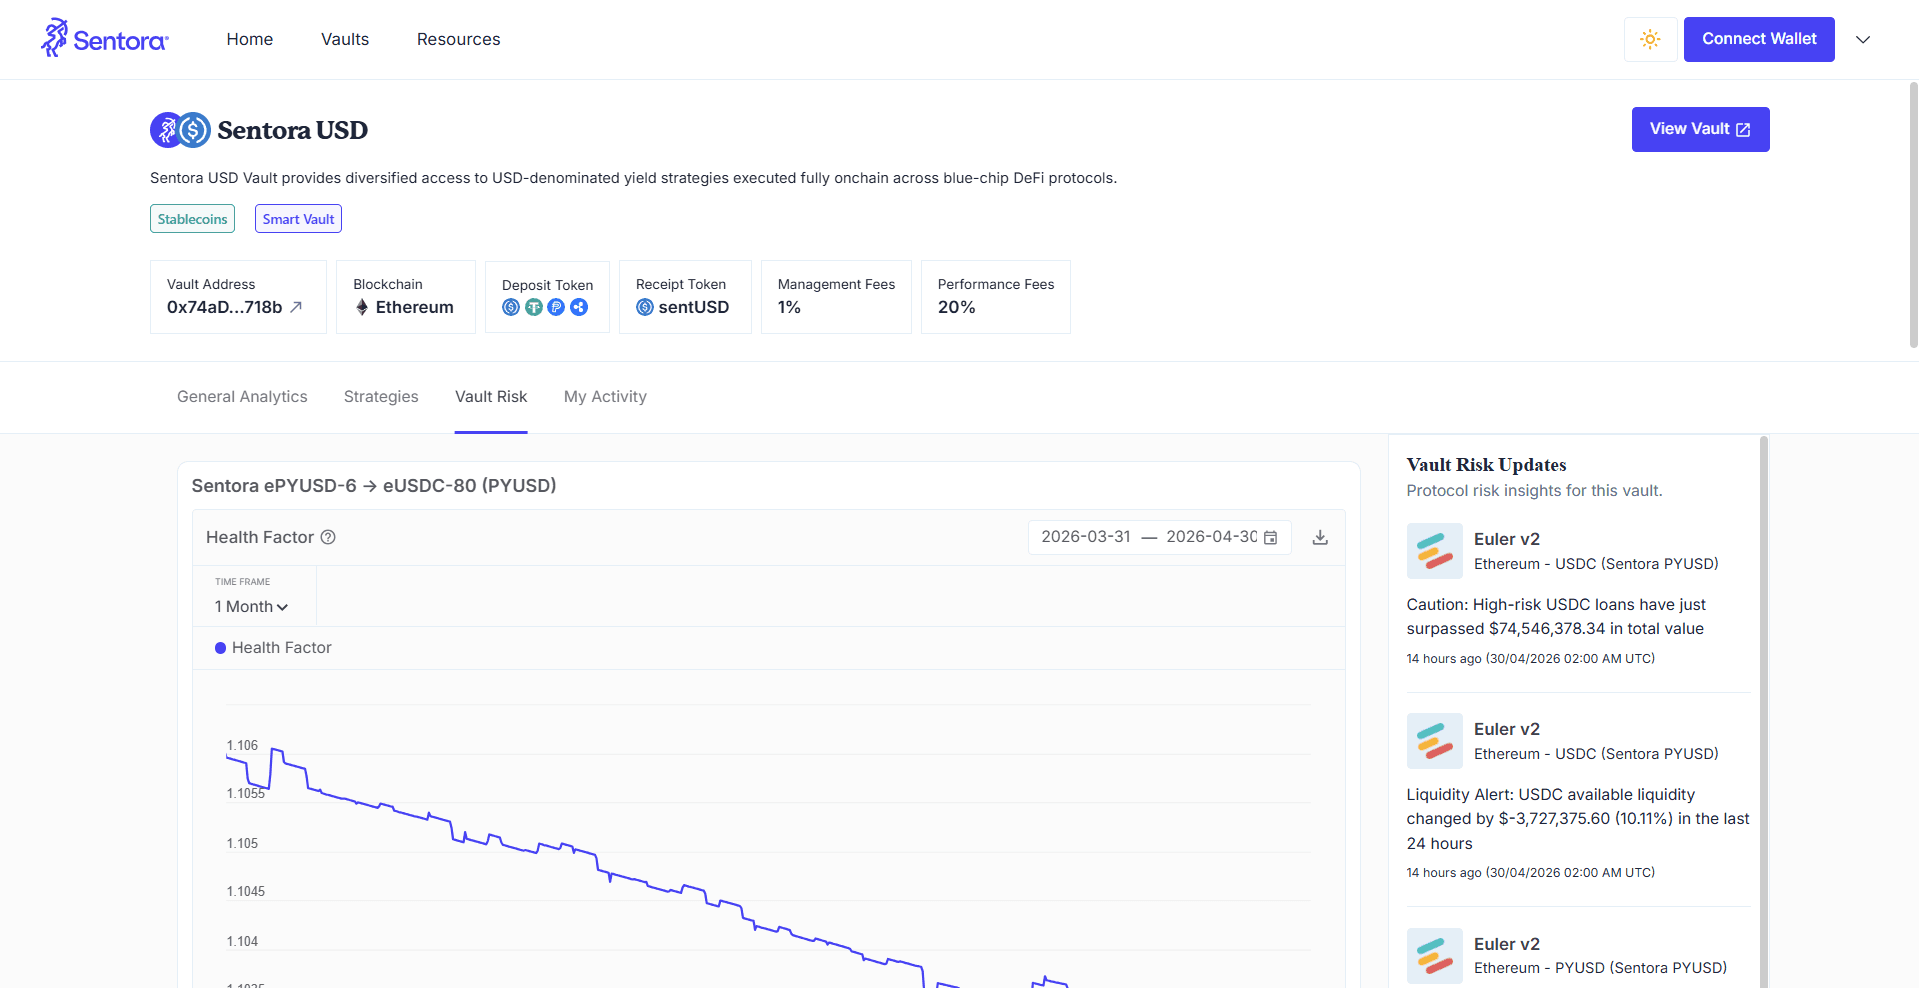
Source: vaults.sentora.com
For users who want to dive deeper into the specific protocol metrics and risk alerts, a full dashboard is available for most major protocols at defirisk.sentora.com
The Institutional Standard
Professional allocators do not evaluate yield through a single number. Before committing capital to a strategy, they want to understand the source of return, the conditions under which that return changes, the liquidity available to exit, the protocol dependencies involved, and how the position behaves in scenarios where markets move against it.
DeFi has no equivalent baseline for retail participants. There is no standard format for presenting strategy mechanics alongside return figures. There is no common language for communicating how vault risk profiles differ. Users are largely expected to reconstruct this picture from documentation, smart contract parameters, and protocol dashboards, or to simply trust the number.
The next phase of DeFi adoption will require that analytical layer to become standard, not exceptional. As more capital enters the space from participants accustomed to structured diligence, the pressure on protocols and platforms to communicate risk clearly will increase.
The headline APY is not going away. It is simple, comparable, and sufficient for users who have already done the underlying analysis. But for everyone else (which remains most of the market) the number at the top of the interface is the last piece of information they should be looking at, not the first.


