
This week, the crypto markets remained in a consolidation phase following the Q4 2025 volatility, with Bitcoin hovering in the 89k-92k range.While on-chain DeFi volume across Solana and Ethereum L2s has seen a slight dip in stablecoin velocity, the institutional narrative has taken center stage once again.The headline of the week is undoubtedly Strategy Inc. (formerly MicroStrategy) executing one of its most aggressive capital deployments to date, providing a substantial liquidity backstop during this lateral market chop.
Let’s dive into the data.
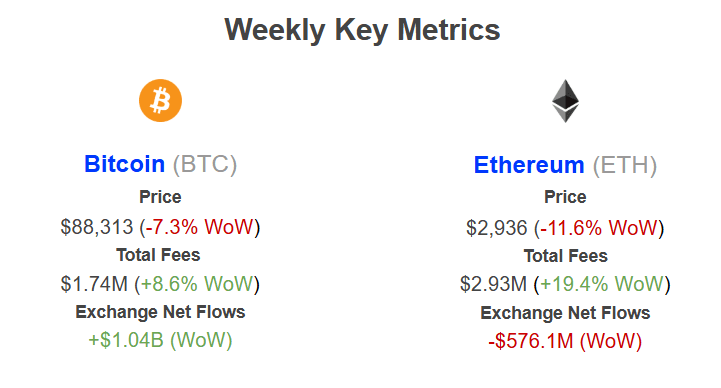
Weekly Key Metrics
Network Fees
Bitcoin: Fees expanded +8.6% to $1.74M despite the -7.3% price contraction. This negative correlation suggests network activity was driven by “rush-to-exit” transfers to exchanges rather than healthy ecosystem utilization, increasing the cost of block space during the sell-off.
Ethereum: Revenue spiked +19.4% to $2.93M while price tumbled -11.6%. This is a classic signature of volatility-induced congestion, where DeFi liquidations and arbitrage bots crowd the network to rebalance positions, keeping fees high even as asset value drops.
Exchange Netflows
BTC: A clear bearish signal with +$1.04B in net inflows to exchanges. This surge in liquid supply on order books correlates directly with the week’s price weakness, indicating that investors were actively moving coins to venues to sell or margin hedge.
ETH: A constructive divergence occurred with -$576.1M in net outflows (withdrawals). Unlike Bitcoin, Ethereum is leaving exchanges, suggesting that the -11.6% drop is being used as an accumulation opportunity.
MSTR Crosses the 700,000 Bitcoin Threshold
The “Bitcoin Treasury Company” has kicked off the new year with high-velocity execution of its capital markets strategy. In a regulatory filing disclosed on January 20 MSTR confirmed the acquisition of an additional 22,305 BTC, valued at approximately $2.13 billion. This marks the firm’s largest single deployment since July 2025 (in dollar terms) and pushes their total holdings across the psychological 700,000 BTC threshold.
Strategy’s accumulation machine is accelerating, fueled by the upsized “42/42” capital plan (formerly the 21/21 plan). The latest purchase data reveals a company willing to buy aggressively near the local range highs of this consolidation block:
Purchase Amount: 22,305 BTC
Total Cost: ~$2.13 Billion
Average Execution Price: ~$95,284 per BTC
Total Holdings: 709,715 BTC
Total Portfolio Value: ~$63.5 Billion
This signals that Saylor and the executive team are prioritizing BTC per Share (Yield) accretion over trying to time local bottoms. The firm is effectively dollar-cost averaging into the “Digital Gold” thesis regardless of the 28% drawdown from the October 2025 All-Time Highs ($126k).
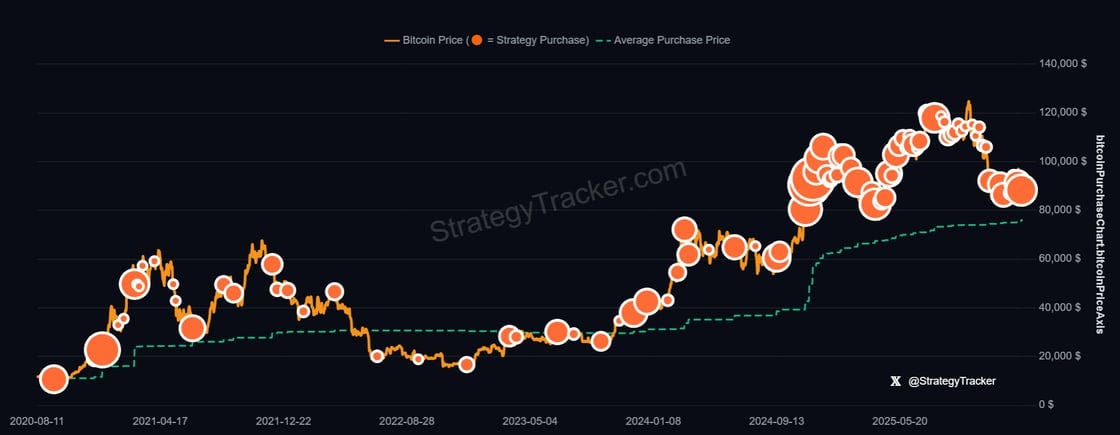
Source: StrategyTracker.com
Unlike previous acquisitions funded by convertible notes (debt), this $2.13 billion tranche was funded entirely through At-The-Market (ATM) equity offerings.
The Mechanism: Strategy sold approximately 10.4 million shares of Class A common stock directly into the market.
The Logic: With MSTR stock trading historically at a significant premium to its Net Asset Value (NAV), often hovering between 1.5x to 2.0x, the company can issue overvalued equity to buy the underlying asset (BTC). Lately this premium has decayed under 1.0x, which could limit their future purchases.
The Result: While this technically increases the share count (dilution), the BTC per share metric actually increases because the stock premium could allow them to buy more Bitcoin per dollar of equity sold than the existing ratio implies.
However, relying solely on equity issuance carries risks. If the MSTR premium compresses even more (due to fatigue or regulatory pressure), the accretion math becomes less favorable. Currently, the “BTC Yield” remains the company’s north star, with the firm reporting a robust year-to-date yield despite the stock issuance
Key Weekly DeFi Metrics
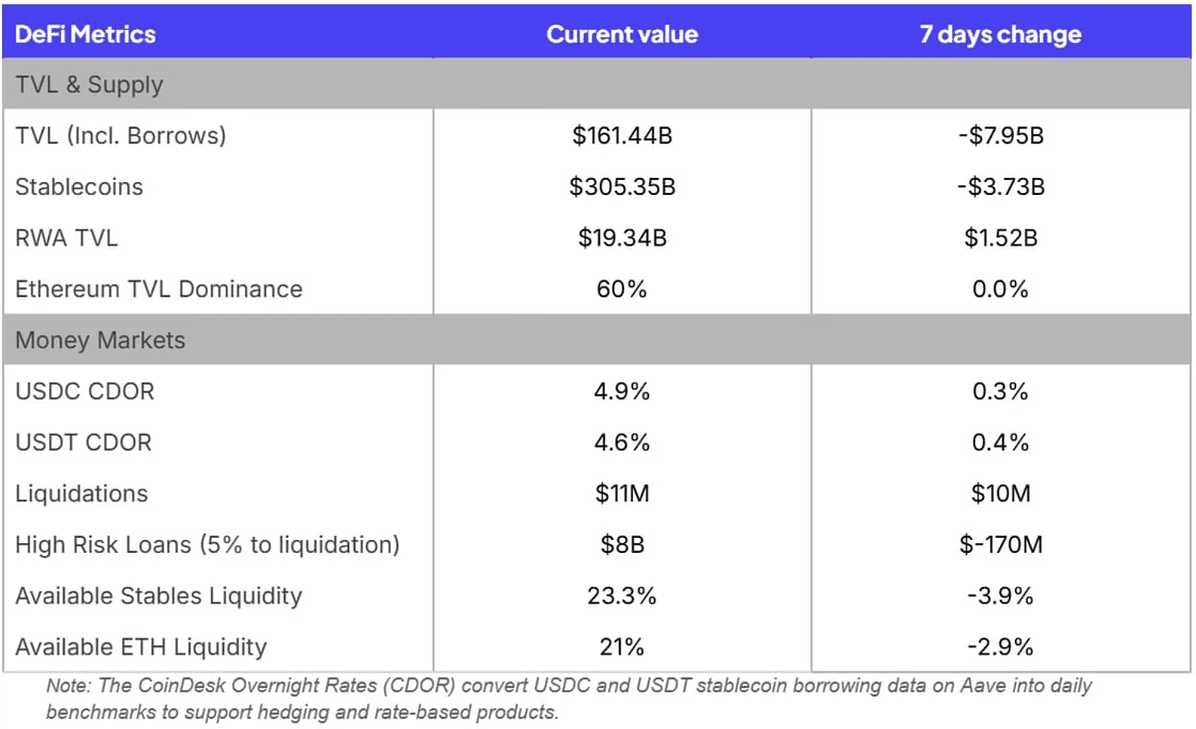
This week we saw a strong increase in liquidations volume, coinciding with the sharp drop in TVL.
Our key takeaways for this week are:
Relatively flat changes in TVL and Supply
Stablecoin borrow costs are creeping up as available liquidity decreases in the market
The Yield-Bearing Asset Spectrum: Distinguishing between risks and returns on assets
Yield-bearing stablecoins and “synthetic” dollar-like tokenized strategy portfolios have been growing rapidly in the last year. While these products have had relatively low market penetration compared to traditional stablecoins, they are likely to see growth in the coming year.
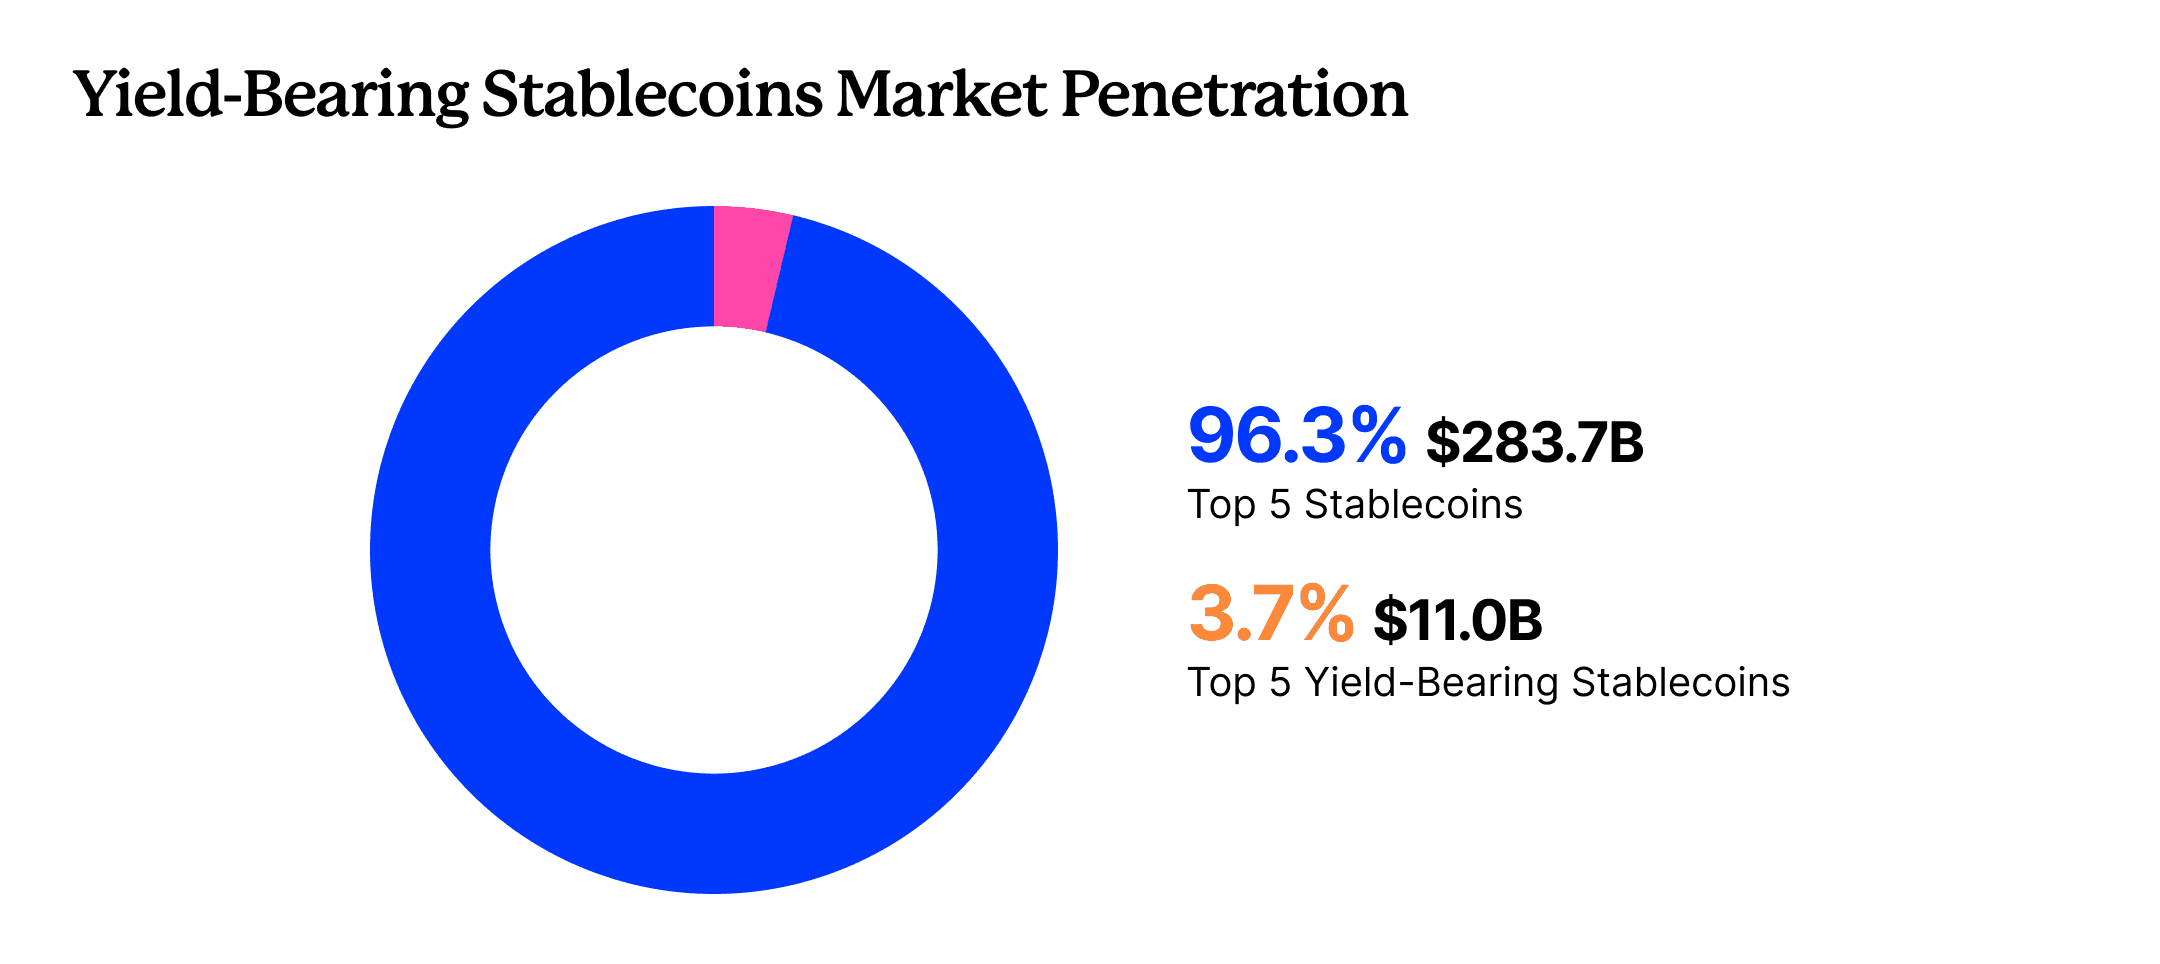
Source: Sentora Research
These products wrap real-world rates, such as tokenized Treasuries or crypto-native basis trades, into something that looks like a stable, yield-producing dollar. The barrier to creating these instruments has never been lower thanks to standardized vault infrastructure, but the operational execution is far more complex. Yields depend on continuous execution: hedging, rebalancing, liquidity management, counterparty selection, and managing stress behavior when funding flips or volatility spikes.
The crucial distinction users must understand: yield-bearing stablecoins target a $1 peg with passive yield generation mainly from treasury bills (Ethena USDtb or Superstate USTB), while tokenized strategy vaults have NAV that fluctuates based on active strategy performance with no principal guarantee. Both may appear as “productive dollars” in a portfolio, but the risk profiles differ dramatically. Within vaults alone, risk sits on a wide spectrum, ranging from Treasury-backed wrappers to complex delta-neutral strategies with embedded leverage, basis risk, oracle dependencies, and forced unwind dynamics.
Where this can become systemically dangerous is when these assets or their derivatives are introduced as collateral. Vault tokens are increasingly split into PT-like constructs and looped through DeFi, stacking leverage on leverage. Using these assets as collateral can generate high returns, but the inherent risks of the assets dropping in value due to negative carry in one of the vault’s underlying positions or a loss write off can cause instantaneous liquidations and potential bad debt.
For stablecoin lenders in curated markets, this creates asymmetric risk transfer. On platforms like Morpho and Euler, tokenized vaults are often grouped alongside traditional stablecoins as “stable” collateral. In stress, sophisticated borrowers can extract USDC/USDT while leaving the lending pool holding impaired vault collateral, socializing bad debt to remaining liquidity.
The Stream Finance collapse in November 2025 illustrated this starkly: xUSD crashed from $1 to $0.43 following a $93M off-chain position loss, triggering $137M in bad debt absorbed by lenders in money markets and prompting $1B+ to flee yield platforms within one week.
Risk Assessment Checklist:
Verify whether an asset targets a peg (stablecoin) or allows NAV fluctuation (vault token)
Assess liquidity depth relative to leveraged positions using the asset as collateral
Understand oracle methodology for complex yield-bearing tokens
Review curator transparency and strategy disclosure in curated lending markets
Monitor Pendle PT discount rates as early deleveraging signals