Onchain credit markets let one party deposit an asset and another borrow against collateral, with interest flowing from the second to the first. They are among the largest and longest-established parts of the decentralized finance system, and they produce most of the returns quoted to institutions considering a first deployment.
However, the interest rates driving these returns are governed by a formulaic mechanism that has no direct counterpart in a traditional administered deposit book.
A contract sets the interest rate in an onchain credit market by calculation. It reads the proportion of its deposits that borrowers have taken, applies a formula published in its own code, and passes the result to depositors after retaining a defined share. The computation reruns on every interaction with the market, and no party reviews the outcome before it reaches whoever is quoting a rate downstream.
A bank or neobank reaches the same number through an administered process. Pricing committees weigh the cost of funds, the competitive position of the deposit book, the expected path of policy rates and the elasticity of the customer base, and the rate changes when the committee decides it changes. That process gives a product team a stable number to build a proposition around and a finance team a predictable margin. Replacing the committee with a formula removes the stability alongside the deliberation, which is how an onchain deposit rate can move by tens of percentage points inside a single day while borrowing demand and credit quality hold steady. The movement is a designed output of a liquidity management mechanism, and its magnitude is predictable from parameters that can be read directly from the contract.
That function takes a single input: utilization, defined as the proportion of supplied capital that has been borrowed. A market with 100 million units supplied and 80 million units borrowed has utilization of 80 percent. Every rate in the market, on both sides, is a function of that number.
Utilization: The Single Lever for Market Equilibrium
A depositor in an onchain credit market expects to withdraw on demand, and that expectation can only be met from the portion of supplied capital that has not been lent out. The rate function exists to protect that portion. At 100 percent utilization, the market holds nothing available to withdraw, and depositors stay in until a borrower repays.
Price is the only counterweight the market has to prevent that state: as utilization rises, the borrowing rate rises, which discourages further borrowing and encourages repayment. The higher rate also flows through to depositors, which attracts additional supply. Both effects push utilization back down. The mechanism performs the job that a liquidity coverage requirement and a treasury desk perform inside a bank, using a single price signal to do it.
Credit risk sits elsewhere in the design, which changes what the rate is actually paying for. Loans are overcollateralised and enforced automatically, so the rate compensates depositors for liquidity constraint and for the risk of the venue itself. Borrower default probability sits outside the calculation entirely, because the design assumes the collateral covers it. A treasury reader comparing an onchain deposit rate against a money market fund yield is comparing two numbers that compensate for different things.
Designing a customer earn or savings proposition on these markets? Sentora works with fintechs and banks on products built over onchain credit, including the buffer mechanics that make a variable rate presentable to a retail customer. Design an earn product with Sentora →
The Mechanics of Kinked Curves
The prevailing design is a piecewise linear function with a deliberate discontinuity in its slope. Generally, it’s built on four variables: the base rate at zero, the target utilization (the kink), a shallow slope for normal conditions, and a steep, aggressive slope for when capital starts running low.
Below the kink, the borrowing rate rises gradually as utilization increases, because capital in that range is being used productively while withdrawal capacity remains intact. Above the kink, the rate rises sharply, because the market has started consuming the liquidity buffer that depositors rely on.
Aave's V3 documented parameters for its USDC market on Ethereum have used an optimal usage ratio of 0.92, a base variable borrow rate of zero, a slope of 4 percent below the kink and a slope of 14 percent above it. Governance sets these values per asset and can change them.
The steepness above the kink is more aggressive than the headline slope figure suggests, because the slope is applied across the remaining utilization range. With a kink at 80 percent, the second slope is divided by the 20 percent of range that remains, which multiplies its effect fivefold. Moving the kink to 99 percent shrinks that denominator to 1 percent and multiplies the slope effect twentyfold, converting a gradual increase into a vertical wall. Parameter selection at this point in the curve determines whether a market under stress produces a high rate or an unusable one.
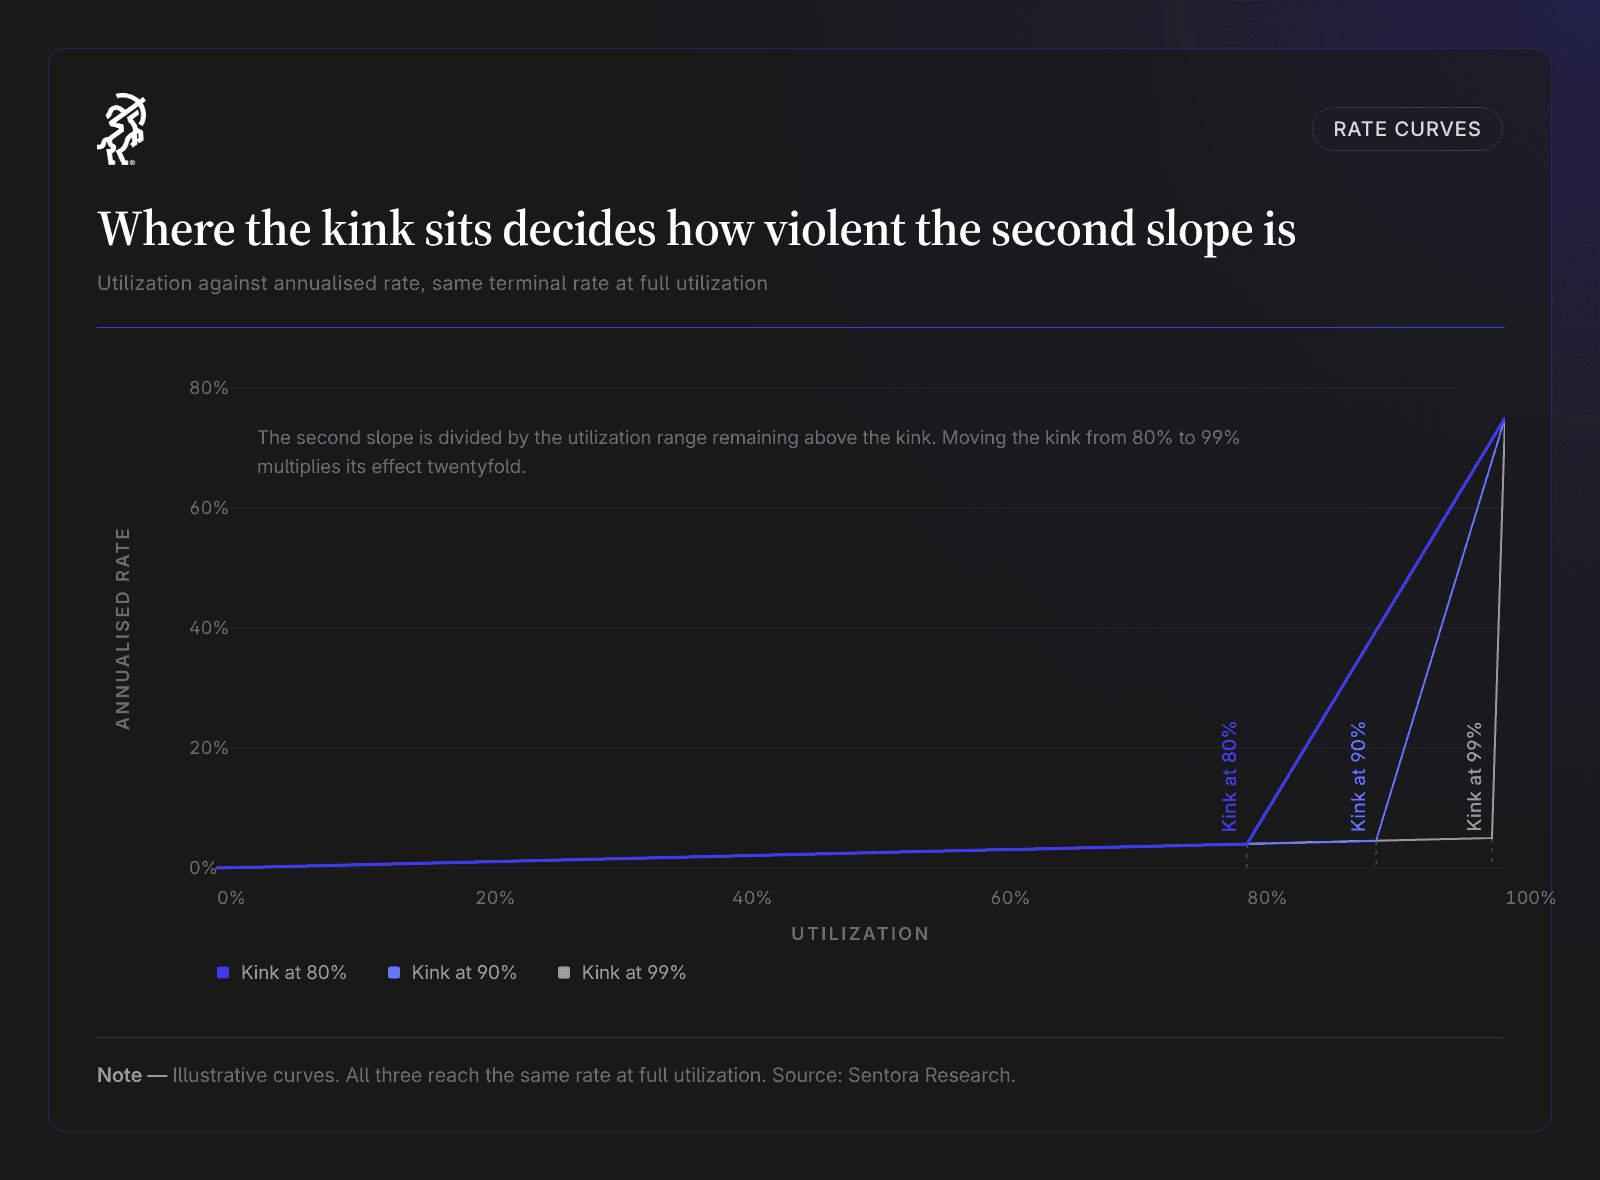
Figure 1. The kinked rate curve at three target utilization points. Parameters are illustrative and chosen for clarity.
Parameters of this kind are adjusted in response to conditions, which makes them active risk controls with a live change history. Any rate quoted to a customer sits downstream of decisions of this kind.
How Adaptive Curves Shift the Whole Schedule
A fixed curve prices utilization accurately and holds its calibration against one interest rate environment only. When the general level of rates moves, a market whose curve was set for the previous environment prices poorly, and correcting it requires a governance vote in traditional lending protocols. Adaptive models address that by adjusting the curve itself over time.
Morpho's Adaptive IRM targets utilization of 90 percent and combines two mechanisms:
A curve mechanism handles short-term utilization in the manner of a conventional kinked model.
An adaptive mechanism then shifts the entire curve up or down according to how far observed utilization has persisted from the target, allowing the rate level to converge on a market equilibrium.
The published constants set curve steepness at 4, target utilization at 90 percent, and an adjustment speed of 50 per year, with an initial rate at target of 4 percent.
The adjustment is deliberately slow, and the speed changes the shape of the rate a depositor experiences. Utilization sustained at 95 percent causes the rate to double over roughly ten days, and utilization sustained at 100 percent causes it to double over roughly five days, which is the maximum speed the mechanism permits. Utilization sustained at 45 percent halves the rate over roughly ten days. A temporary utilization spike therefore passes through with little effect on the rate, while a sustained change in borrowing demand reaches the depositor over days.
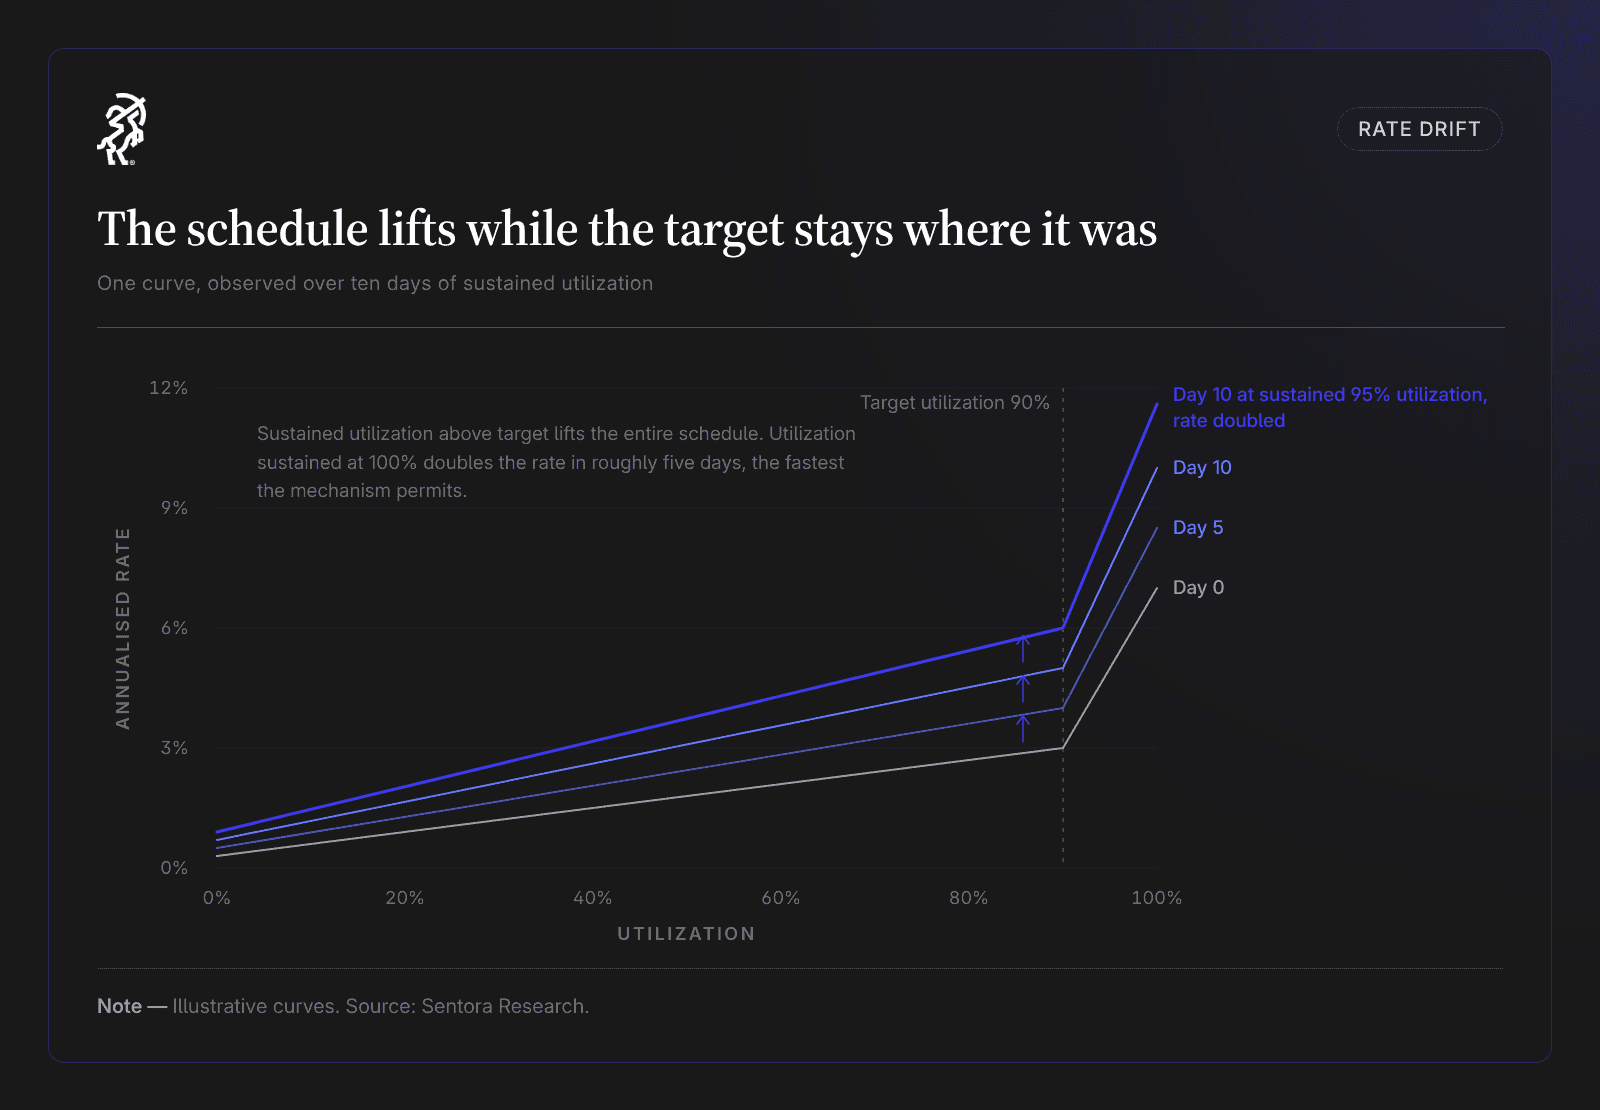
Figure 2. An adaptive model lifts the whole schedule while the target utilization point stays fixed.
From Borrowing Rate to Deposit Rate
Depositors receive less than borrowers pay, and two separate effects open that gap. A product team should model both, because applying one without the other overstates the rate available to customers by a wide margin at low utilization.
The first effect is arithmetic, and it follows from where the interest is collected against where it is spread. Interest is paid by borrowers on the borrowed portion only, and it is distributed across the whole supplied balance. At 60 percent utilization, a 3 percent borrowing rate generates income equal to 1.8 percent of supplied capital before any deduction. Utilization therefore enters the deposit rate twice, once inside the curve and once as the scaling factor applied to it.
The reserve factor accounts for the second effect, meaning the share of interest income the protocol retains before passing the balance to depositors. Reserve factors in the range of 10 to 20 percent are typical. This is the venue's revenue line, and it functions in the same way as the spread a bank retains between its lending and deposit rates. Combining both effects gives the working relationship for a kinked model: the deposit rate equals the borrowing rate multiplied by utilization multiplied by one minus the reserve factor.
Worked Example: What a Ten Point Move in Utilization Does
Applying a kinked curve with a base rate of zero, a kink at 80 percent, a first slope of 4 percent, a second slope of 75 percent and a reserve factor of 10 percent produces this schedule. Figures use round numbers for clarity.
Utilization | Borrowing rate | Deposit rate | Comment |
|---|---|---|---|
60% | 3.00% | 1.62% | Below target. Ample withdrawal capacity, modest return. |
80% | 4.00% | 2.88% | At target. The market is designed to sit here. |
90% | 41.50% | 33.62% | Ten points above target. The second slope dominates entirely. |
95% | 60.25% | 51.51% | Withdrawal capacity is nearly exhausted. |
100% | 79.00% | 71.10% | Withdrawal is unavailable at any price. |
Figure 3. Illustrative rate schedule for a kinked interest rate model. These are illustrative values chosen for clarity and are not live market settings. Deposit rate equals borrowing rate multiplied by utilization multiplied by (1 minus reserve factor).
Growing a tokenized dollar balance and looking for a return that survives underwriting? Sentora builds and operates the strategies that put institutional tokenized cash to work under a governed mandate. Talk to Sentora about tokenized cash →
The second scenario is the one a treasury function should rehearse.
Take a market with 100 million units supplied and 80 million borrowed, sitting exactly at its 80 percent target with a deposit rate of 2.88 percent. A single depositor withdraws 10 million units. Supplied capital falls to 90 million while borrowed capital holds at 80 million, so utilization moves to 88.9 percent. The borrowing rate becomes 37.3 percent and the deposit rate becomes 29.9 percent.
One withdrawal of 10 percent of the deposit base moved the customer-facing rate by more than 27 percentage points. Borrowing demand was unchanged, credit quality was unchanged, and governance took no action. A rate presented to retail customers as a savings return has to be smoothed through a reserve buffer, or presented as variable in terms the customer genuinely understands.
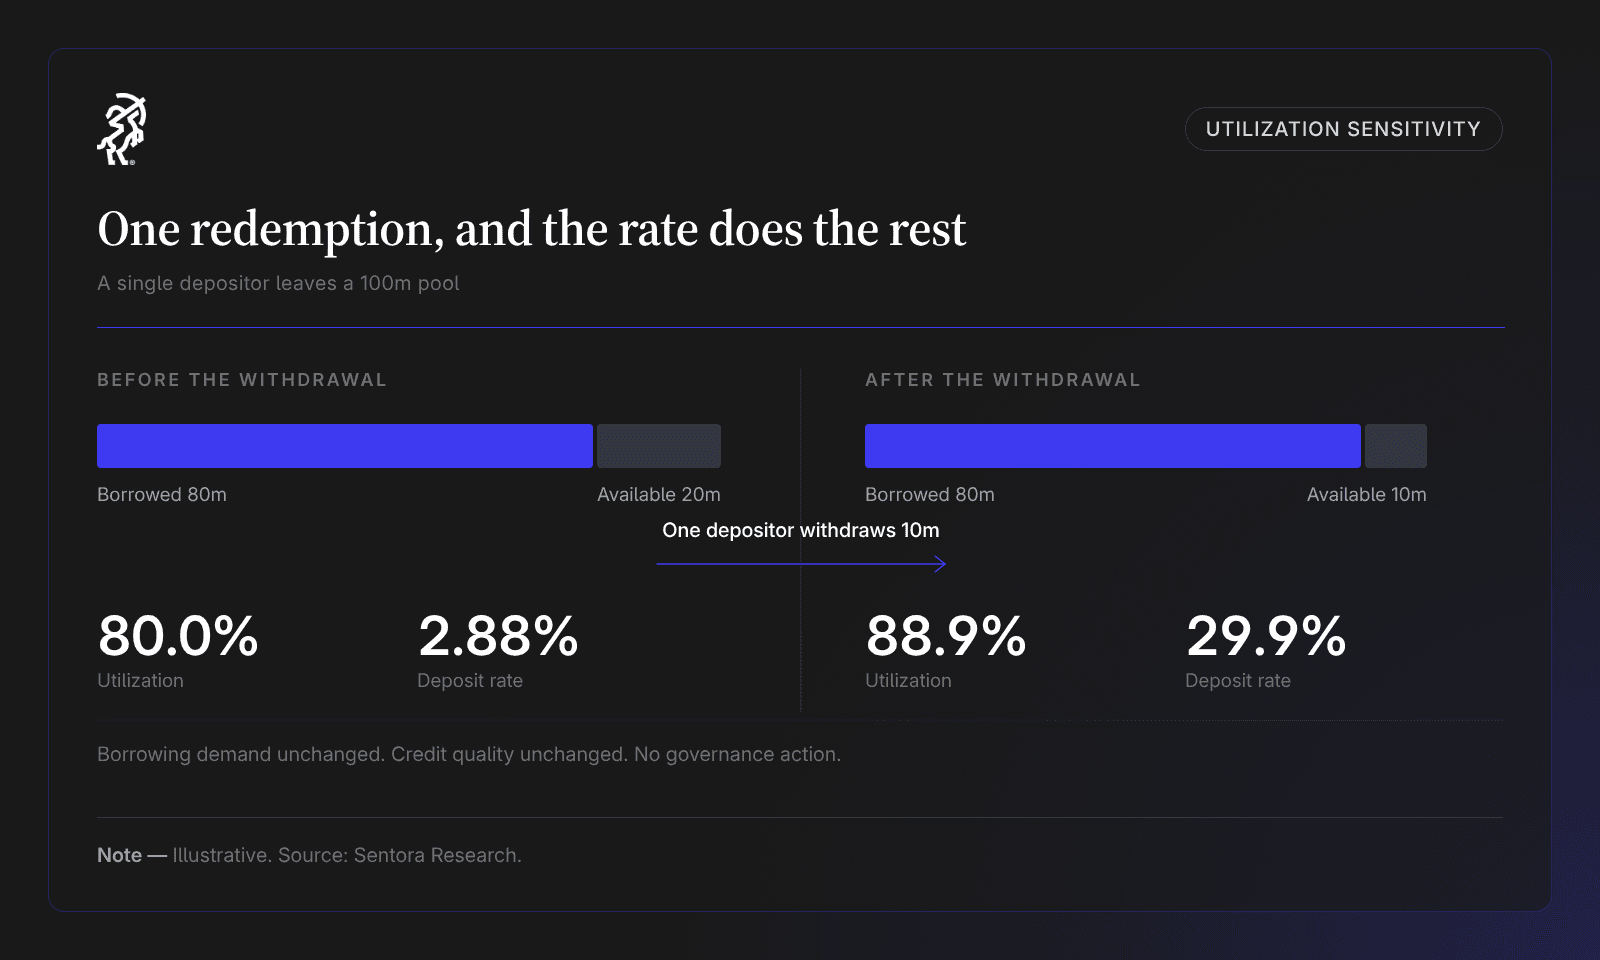
Figure 4. A withdrawal of 10 percent of the deposit base moves the customer-facing rate by more than 27 percentage points.
Comparison Against Administered Deposit Pricing
Attribute | Administered bank deposit rate | Utilization-set onchain rate |
|---|---|---|
Who sets it | Pricing committee, within a policy | A published function of utilization |
Update frequency | Weeks to months | Every interaction with the market |
Primary driver | Cost of funds and competitive position | Ratio of borrowed to supplied capital |
What the rate compensates for | Term, competition and the bank's funding need | Liquidity constraint and asset/protocol risk |
Predictability for a product team | High, with a known change process | Computable from parameters, forecastable only within the current regime |
Governing document | Pricing policy | Contract parameters, changeable by governance |
Figure 5. Structural comparison of rate formation. The right-hand column describes the general mechanism and not any specific venue.
Reading the Curve From the Contract
Every input to a quoted rate sits on chain and can be read before a customer proposition is built on it. Four parameters and one observation are enough to reconstruct what a depositor will actually receive and how far it can move.
What to read | Where it sits | What it decides | Warning sign |
|---|---|---|---|
Base rate, kink, first slope, second slope | The interest rate strategy contract for that asset | The entire shape of the curve, including how violent the move above target becomes | A kink above 95 percent, which multiplies the second slope into a wall no borrower can service |
Reserve factor | Reserve configuration | The venue's cut before depositors are paid, typically 10 to 20 percent | A rate quoted to the institution with this not yet deducted |
Current utilization | Supplied and borrowed balances | Where on the curve the market is sitting today | A market designed for 80 percent that habitually runs above 90 |
Utilization range over the past quarter | Historical balances | Whether the market lives at target or above it | A range whose floor sits above the kink |
Governance rights and timelock | The venue's governance contracts | Who can move the curve after capital is committed, and how much notice arrives | Parameter changes executable without a timelock |
Figure 6. What to pull from the contract before quoting a rate downstream.
There are two conditions that stop the model working altogether, and both reach past the ordinary movement of a rate along its curve. One is a borrower population that cannot respond to price at all, which happens when collateral has fallen far enough that repaying requires selling into the same falling market. Utilization then stays pinned high while the rate escalates, and depositors accrue an impressive return they cannot realise because nothing is available to withdraw. The rate at that point measures how trapped the depositor is.
The other is an adaptive curve lagging in both directions at once. Adjustment over days protects depositors from reacting to noise, and it also delays a genuine and sustained increase in borrowing demand from reaching them as income, so a product promising to pass through market rates will lag during exactly the weeks customers watch rates most closely.
Both conditions converge on the same product decision, and it has to be made before a customer sees a number. A rate this volatile reaching a retail customer needs a reserve buffer absorbing the movement shown in Figure 4, and somebody inside the institution has to fund that buffer and say so.
Rate formation determines what a deployment returns and how stable that return will be. Sentora's strategy infrastructure is built for institutions that need to underwrite the mechanism behind the headline number.
Rate formation determines what a deployment returns and how stable that return will be. Sentora's strategy infrastructure is built for institutions that need to underwrite the mechanism behind the headline number.