DeFi capital concentrates in three categories, with lending holding the largest share, liquid staking turning staked assets into reusable collateral, and decentralised exchanges supplying the liquidity that lets assets trade.
Each category has a few protocols holding most of its capital and one clear leader, so that Aave leads lending, Lido leads liquid staking, and Uniswap leads a more divided exchange category.
This article looks at how that capital behaves once it is in motion, drawing on protocol-level data through the most recent market cycle. It covers where capital goes when conditions deteriorate, a shift in lending models taking shape behind the leaders, the spread of staking onto chains beyond Ethereum, and the way a position in an exchange amounts to a position in the chain that exchange runs on.
Under Stress, Capital Moves Toward the Deepest Venues
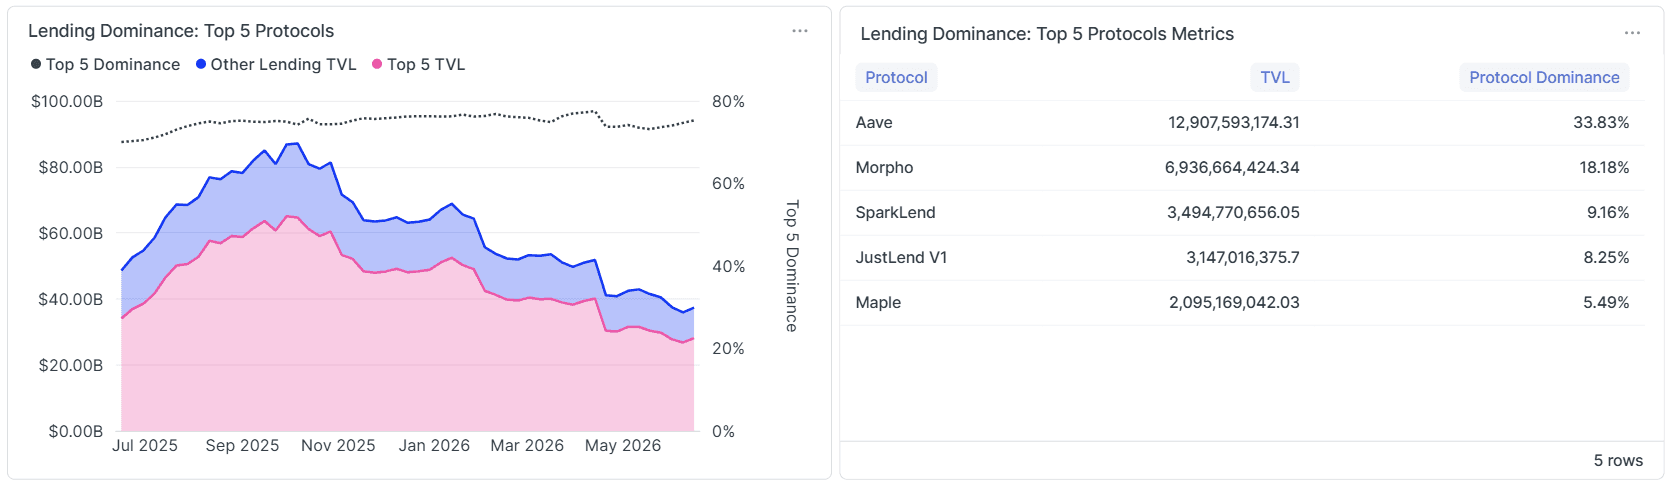
The most pronounced behaviour in the data is a flight to quality. As total value contracted from its 2025 peak, top-five dominance in lending and liquid staking held firm or rose, so the capital that remained concentrated further into the largest venues even as the totals declined.
In practice, this meant consolidation into Aave and Lido, because worsening conditions lead capital to treat the deepest, most integrated, and most thoroughly tested venues as the safer place to sit. Withdrawals come first from the smaller protocols, while the leaders keep their capital and gain share from the rest. Concentration and contraction move together in this way, in a counter-cyclical pattern that is visible here at the level of named protocols, and the behaviour is rational for each allocator who chooses it even as those individual choices together deepen the system's reliance on a few venues at the very moment that reliance matters most.
Depth Feeds on Itself Under Stress
This flight to quality carries a second-order effect worth drawing out: each allocator who moves to the largest venue during a downturn makes that venue larger and deeper, which in turn makes it the obvious destination for the next allocator, so a move made for the sake of safety strengthens the case for the same move by everyone behind it.
Depth becomes self-reinforcing under stress, which is the mechanism behind rising dominance in a downturn seen from the inside, and it explains why leaders rarely lose their position when conditions deteriorate.
In short, the conditions that test every protocol are the same conditions that send capital toward the few that look safest, so the test tends to confirm the existing order in place of upsetting it, and concentration proves most durable in exactly the markets where its risks matter most.
The Shift Behind Morpho's Rise
Morpho holds 17.89% of lending, behind only Aave, and the model behind that share is what makes it significant. A conventional lending market pools many assets together and applies shared risk parameters across all of them, so a problem with one asset can affect depositors exposed to every asset.
Morpho instead separates lending into isolated markets, each defined by a single collateral asset, a single borrowed asset, and its own parameters, with the risk in one market kept apart from the others. The work of judging which markets are sound falls to curators, who build and manage vaults on top of the base layer and assess the risk parameters for the vaults they curate.
Capital moving into this structure, to the point that it now holds the second-largest position in lending, reflects demand for credit that isolates risk in place of pooling it and that separates the protocol providing the rails from the parties managing the risk.
Other models hold leading positions as well, with SparkLend running on a lending codebase shared with Aave and tied to the Sky stablecoin system, and Maple extending credit to vetted institutions in place of open overcollateralised markets, which brings a different risk profile into the group. Lending is concentrated at the top and increasingly varied in model underneath, and the standings make that visible.
Staking Moves Beyond Ethereum
Liquid staking has been an Ethereum story for most of its history, and the current top five shows that beginning to change at the edges. Lido and Binance staked ETH remain the two largest providers, both centred on Ethereum, while the names that follow are not.
Kinetiq kHYPE stakes the asset of the Hyperliquid ecosystem, Sanctum operates in Solana's liquid staking market, and Rocket Pool, the other Ethereum name in the group, sits beside them at a comparable size. The arrival of Hyperliquid and Solana staking tokens in the category's top five reflects staking derivatives spreading to the chains that have built their own users and capital, so while the leader remains an Ethereum protocol and Ethereum remains the largest staking base, the category has grown into more than an Ethereum market.
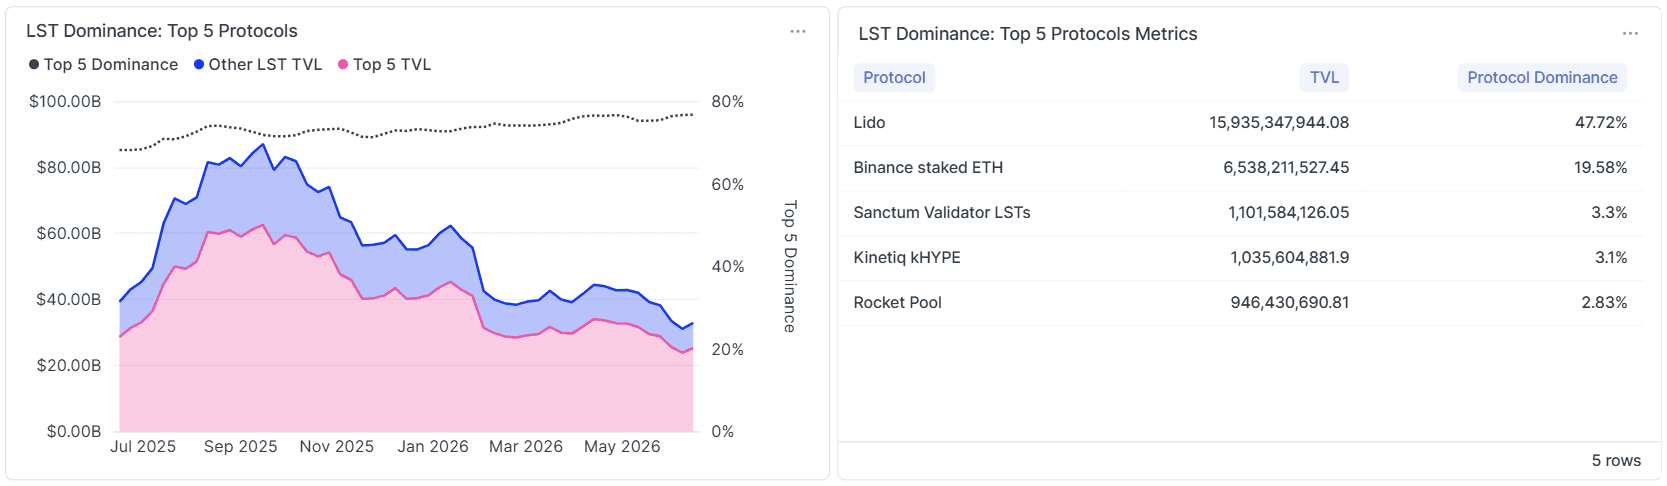
The mix also reveals two distinct routes to scale. Lido reached its position through a permissionless network of node operators and wide integration of its token, whereas Binance staked ETH reached a similar size through a large centralised exchange staking on behalf of its users. This tells an allocator that scale in staking can arise from open infrastructure or from a single custodial operator, and that the two carry very different control profiles behind a similar figure.
A Position in an Exchange Is a Position in a Chain
Decentralised exchange usage maps onto chains directly, and the leaders make the mapping plain, since Uniswap leads on Ethereum and across the chains it has deployed to, PancakeSwap leads on BNB Chain, Raydium leads on Solana, and QuickSwap leads on Polygon. Curve sits among them as the venue specialised in trading between assets meant to hold the same value, such as stablecoins and staking tokens, which makes it infrastructure for the other two categories as much as a destination of its own.
Each of these venues captures the liquidity of its chain, which is the structural reason the category is the least concentrated of the three, and it carries a consequence the headline figure conceals, because allocating to an exchange means allocating to a chain. In other words: a position in Raydium is a position in Solana's liquidity and activity, and a position in PancakeSwap is a position in BNB Chain, so the choice of venue carries the choice of chain with it whether or not the allocator framed it that way.

The Exchange Engine Ran While Inventory Shrank
The most instructive divergence in the data appears in exchange, where the category's share of total DeFi capital rose during the drawdown while the dollar value locked in exchanges fell, so the two moved in opposite directions over the same period.
The explanation lies in what locked capital represents for decentralized exchanges, because an exchange earns from trading volume and the fees it produces while the capital in its pools is only the inventory that makes trading possible. Trading continues in every market regime, since participants swap one asset for another whether prices are rising or falling and often more when prices are moving quickly, so the fee engine keeps running while the locked capital declines alongside asset prices.
The same data supported opposite conclusions about decentralized exchanges, because locked capital pointed to a shrinking category while volume and fees pointed to one holding its place.
Taken together, the data shows capital behaving in consistent and legible ways. It moves toward depth when conditions worsen, which deepens the leaders further, and it rewards lending models that isolate risk, while it carries staking onto new chains at the edges and ties every exchange position to the chain beneath it.
Reading these flows is what turns a static snapshot of market share into a live picture of where the market is heading, and that reading is available to anyone willing to work from the data the protocols publish onchain.
About the data. The Sentora Crypto Dominance Dashboard is a research tool that measures how concentrated capital is across decentralised finance. For each of the three major categories, lending, decentralised exchanges, and liquid staking, it identifies the five largest protocols and the share of the category that each one holds, alongside the share of total DeFi capital that the category represents. The figures are built from onchain data and refreshed regularly, so the dashboard shows both where capital sits today and how its distribution is shifting over time. It is maintained by Sentora Research.
Explore the live data: https://sentora.com/research/dashboards/crypto-dominance