The Anatomy of the Crash
To understand the magnitude of this week’s price action, we must look beyond raw percentage declines and view this move through a statistical lens. The drop on February 1 was a statistical anomaly. We just witnessed a -5.65 Standard Deviation (-5.65σ) move in $BTC using a 200-day lookback.
To put that figure into perspective, a volatility profile of this magnitude has been reached only four times since Bitcoin’s inception on July 14, 2010. This represents 0.07% of all trading days in the asset's history. When moves of this statistical weight occur, they rarely signal a continuation of the status quo, they usually mark either a catastrophic market failure or a generational capitulation bottom.
This move also registered as the 3rd most oversold day in history for BTC. However, amid the carnage, price action halted with surgical precision at a confluence of three distinct, critical valuation metrics. The market found support exactly where fundamental valuation models suggested it should:
Electrical Cost: ~$58,000 (The price at which the average miner breaks even on energy).
Realized Price: ~$58,000 (The aggregate on-chain cost basis of all coins).
200-Week Moving Average: ~$58,000 ( The historic "bear market floor").
The defense of this $58,000 level is technically encouraging. Historically, dipping below the electrical cost forces miners to shut down, leading to hashrate capitulation, a scenario we have so far avoided. However, the sheer velocity of the move down suggests this was not organic selling, but rather a forced liquidation event.
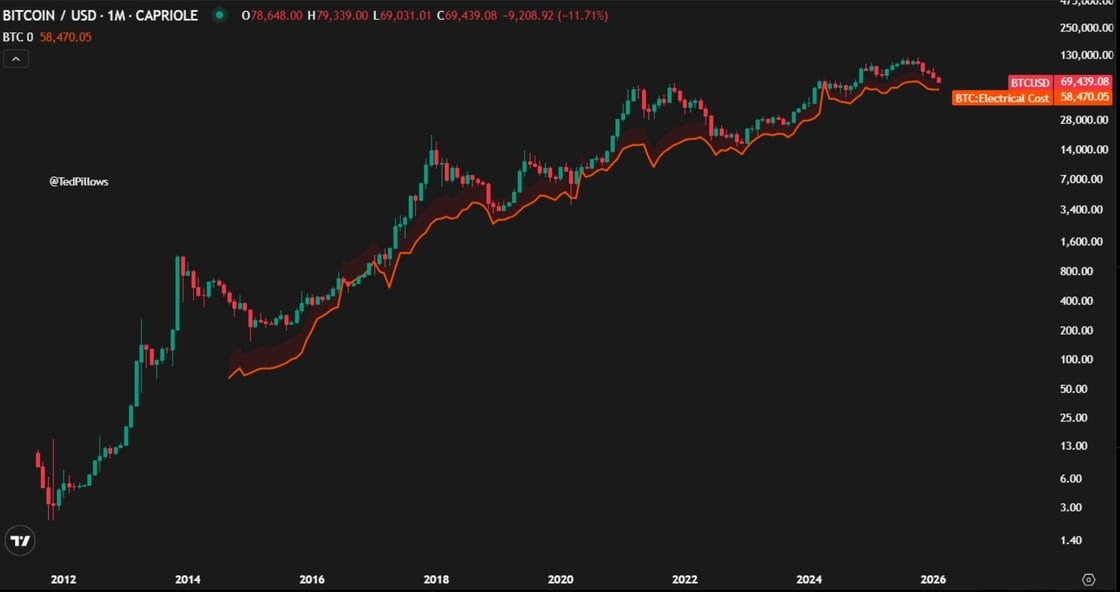
Source: @TedPillows
The ETF Factor: Diamond Hands or Pending Puke?
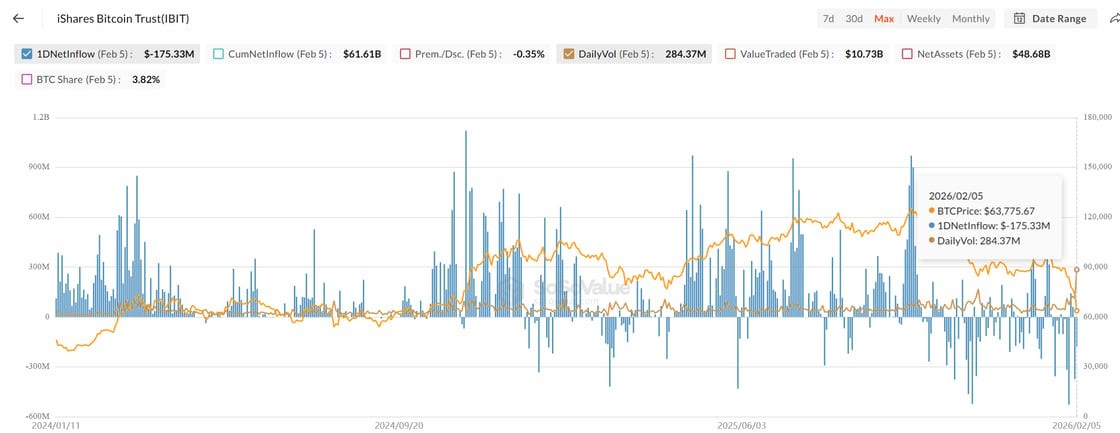
The spotlight for this crash falls squarely on the ETF sector, specifically BlackRock’s IBIT. On February 1, BlackRock's spot $BTC ETF recorded over $10 billion in daily trading volume for the first time ever. This volume spike is a double-edged sword. On one hand, it shows massive liquidity and interest. On the other, it highlights the severe duress ETF holders are currently under. Based on volume-weighted average price (VWAP) analysis, estimations of the average purchase price for a BTC ETF holder is approximately $90,000. With Bitcoin trading in the high $50K region, the average ETF allocator is $16B billion unrealized loss across the sector.
Thus far, ETF "hodlers" largely characterized as institutional allocators, have displayed "diamond hands" during the slow decline. However, the violence of this week's move raises a critical question: Does this severe drawdown set the stage for a final capitulation "puke," or was Feb 1 the clearing event?
The data from IBIT suggests something more complex than simple retail panic.
This was the highest volume day on $IBIT, ever, by a factor of nearly 2x, trading $10.7B. Additionally,roughly $900M in options premiums were traded on IBIT alone, marking another all-time high.
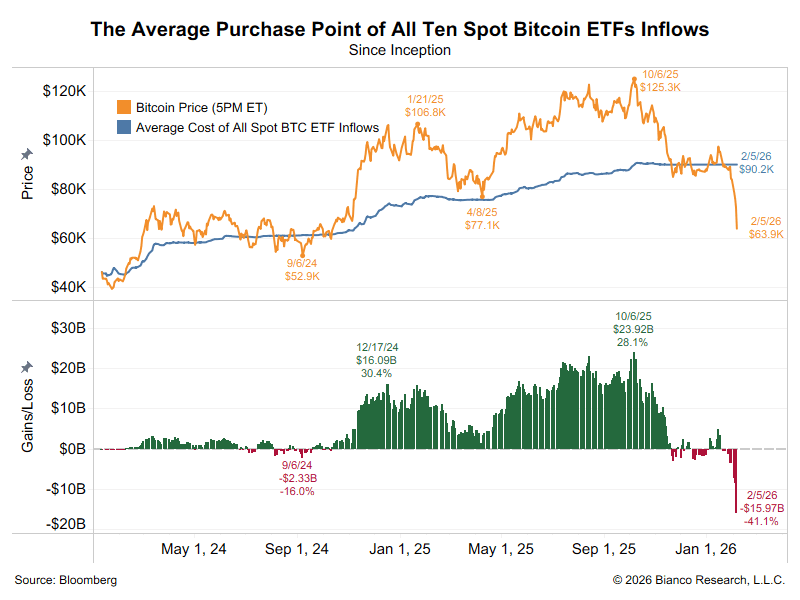
Source: @biancoresearch
While the market narrative has focused on general macro weakness, a forensic look at the order flow suggests a specific culprit. The way the market moved offers breadcrumbs that lead away from crypto-native panic and toward a TradFi-centric blowout.
Liquidations on centralized crypto exchanges (CeFi) were relatively low compared to the magnitude of the price drop. This discrepancy leads us to believe the nexus of the problem lies with a large IBIT holder rather than a Binance or Bybit whale.
IBIT has become the premier venue for BTC options trading. The combination of record spot volume and record options premiums suggests a massive unwind of a levered position.
Source: @SoSoValue
If you examine the 13F filings for IBIT, you will find several funds that hold the majority of their assets in IBIT. This single-asset structure is often utilized to isolate margin. If a trade blows up within such a structure, the brokers have no claim on the parent fund's other assets. Interestingly, a significant concentration of these giant, single-asset funds is based in Hong Kong.
This geographic detail is crucial when viewed against the wider macro backdrop:
The Precious Metals Link: Asian traders, particularly in China, have been deeply involved in the Silver and Gold trade. On the day of the crash, Silver plummeted 20%, the second-largest single-day move in decades.
The JPY Carry Unwind: The Japanese Yen carry trade has been unwinding rapidly, spiking funding costs for funds borrowing JPY to deploy into risk assets.
Connecting these dots paints a plausible scenario: The culprit for the IBIT blowup could have been HK-based non-crypto hedge funds.
Key Weekly DeFi Metrics
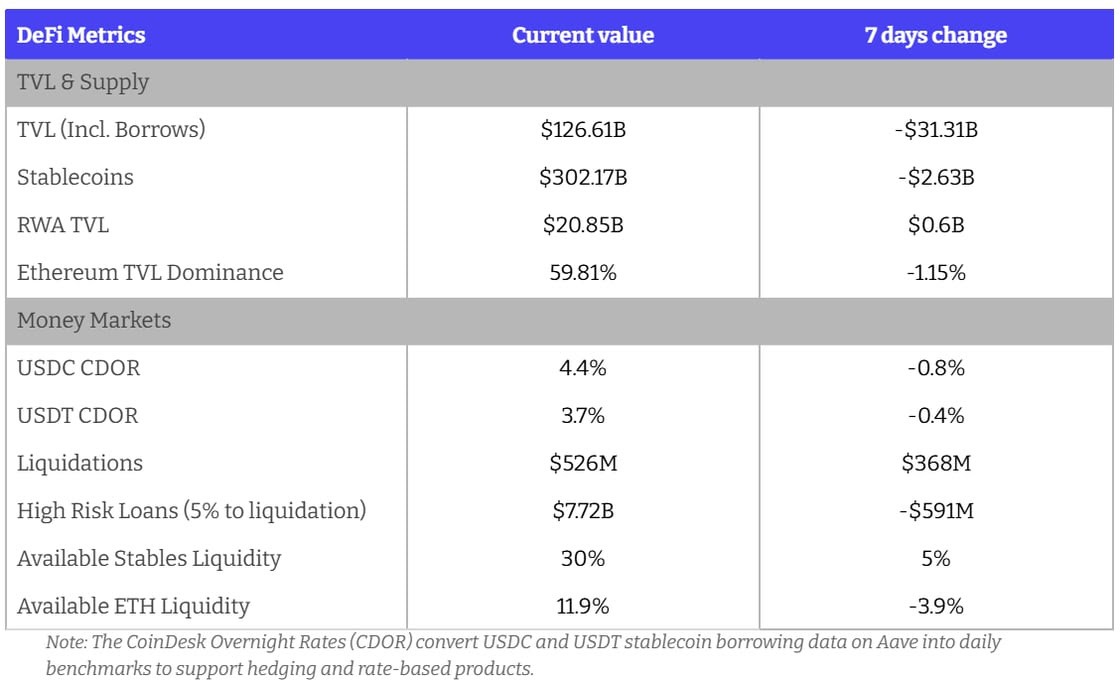
Our key takeaways for this week are:
$30B TVL wiped out due to price action
Stablecoins and RWAs saw minimal change despite large drawdowns
Divergence in available liquidity in Stables and ETH primarily due to price changes
Basis Trade Risks for Yield-Bearing Synthetic Stablecoins
Market Context
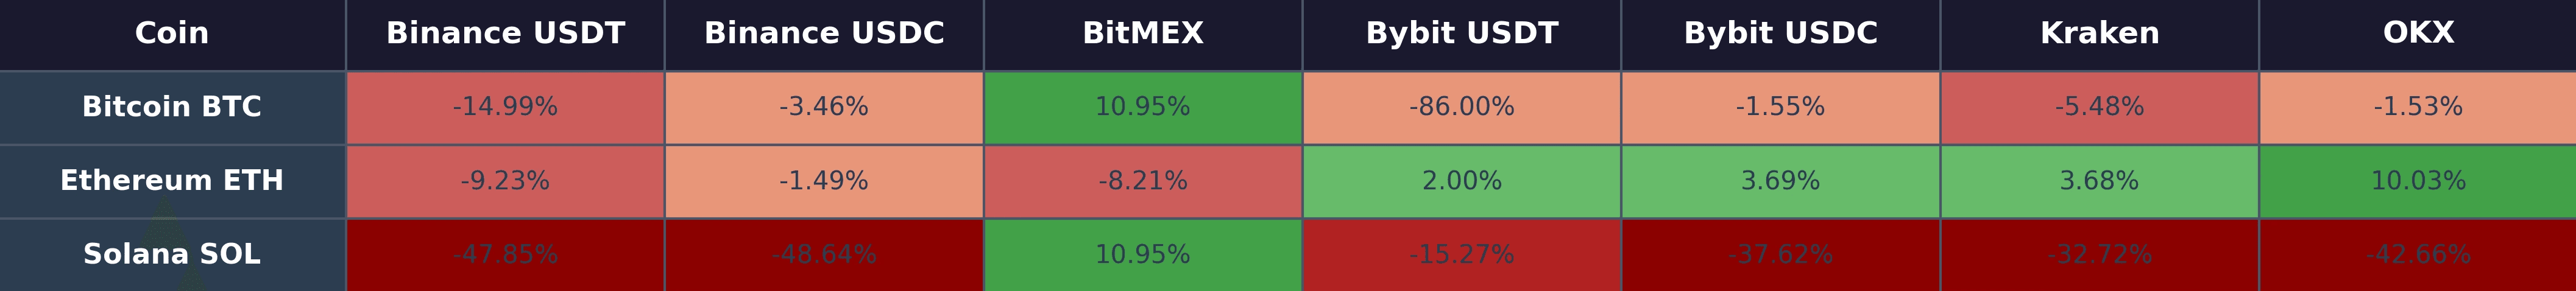
The basis trade (long spot/short perps) powering over $10B in TVL is under pressure as funding rates turn deeply negative due to market deleveraging. BTC annualized funding sits at -1.5% to -15%, ETH at -1.5% to -9.2%, and SOL at an extreme -15% to -48%. With nearly a week of bearish price action, negative funding rates could persist.
Source: Coinalyze
Protocol Impact & Buffers
Persistence beyond one week threatens user principal as funding costs outpace yield. Exposure-specific losses reach ~0.9%/week for SOL and ~0.29% for BTC. To defend the peg, protocols employ varied backstops:
Ethena: Utilizes a $62M insurance fund (roughly 0.85% of TVL) designed to bridge gaps when funding costs exceed the underlying ETH staking rewards.
Resolv: Employs a "junior-tranche" architecture via its $152M RLP pool, which acts as a first-loss layer, absorbing negative funding to keep the senior USR stablecoin yield-neutral or positive.
Long-term survival depends on operational agility: the speed at which managers can unwind underwater perpetual positions and rotate capital into lower-risk, positive-yield venues like T-bill-backed instruments or on-chain lending markets without hitting liquidity bottlenecks.
Leverage & Liquidation Risks in DeFi
A critical second-order risk is the "negative carry" trap affecting $2B+ in sUSDe and Pendle PT derivatives used as collateral on money markets like Aave, Morpho, Fluid, and Euler. As basis yields compress, they risk falling below the cost of borrowing stablecoins (e.g., USDT/USDC) used to leverage these positions.
If borrowing rates flip above collateral yields, the resulting "inversion" could trigger health factors to deteriorate. This could spark a liquidation cascade, forcing the market-selling of yield-bearing collateral into a thin-liquidity environment, potentially leading to a structural impairment of protocol reserves if yields remain suppressed throughout February.